QUESTION IMAGE
Question
inequalities that describe domain and range
complete the inequality below to describe the
domain of the graph shown.
domain
< x ≤ 4
done
complete the inequality below to describe the
range of the graph shown.
range:
≤ y < 5
done
To solve for the domain and range inequalities, we analyze the graph:
Domain:
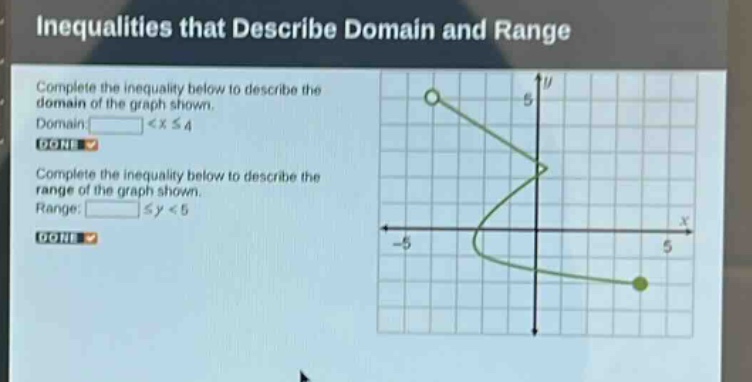
The domain of a graph is the set of all \( x \)-values it covers. Looking at the graph, the leftmost point (open circle) is at \( x = -5 \) (since the open circle indicates \( x = -5 \) is not included, but values greater than -5 are) and the rightmost point (closed circle) is at \( x = 4 \) (closed circle means \( x = 4 \) is included). So the domain inequality is \( -5 < x \leq 4 \). Wait, but the problem has a blank for the left side of \( < x \leq 4 \). Wait, maybe I misread. Wait, the graph: let's check the x-axis. The left open circle: looking at the grid, the x-coordinate of the open circle—let's see the grid lines. The left open circle is at \( x = -5 \) (since the x-axis has -5, 0, 5). Wait, no, maybe the leftmost x is -5? Wait, the domain: the graph starts from an open circle at some x, and goes to a closed circle at x=4. Wait, maybe the left open circle is at x = -5? Wait, no, let's check the range first. Wait, the range: the inequality is \( \square \leq y < 5 \). The closed dot on the right (the lower part) has a y-coordinate—wait, the range: the lowest y? Wait, no, the range is the set of y-values. The graph has a closed dot at the bottom right, and an open dot at the top left (y=5). So the range: the minimum y? Wait, no, let's look at the domain again. Wait, the domain: the x-values. The leftmost x is -5 (open circle, so not included) and the rightmost x is 4 (closed circle, included). So domain: \( -5 < x \leq 4 \). But the problem has \( \square < x \leq 4 \), so the blank is -5. Wait, but maybe I made a mistake. Wait, the graph: the left open circle is at x = -5? Let's check the x-axis: the grid lines are at -5, 0, 5. So the left open circle is at x = -5 (since it's on the vertical line x=-5), and the right closed circle is at x=4? Wait, no, the x-axis on the graph: the right closed dot is at x=5? Wait, no, the x-axis has -5, 0, 5. Wait, the rightmost point (closed dot) is at x=5? Wait, maybe I misread the graph. Wait, the problem says "Domain: \( \square < x \leq 4 \)"—wait, maybe the right closed dot is at x=4? Wait, maybe the left open dot is at x = -5? Wait, no, let's re-express.
Wait, the domain is the set of all x-values. The graph has an open circle at the left (so x > -5) and a closed circle at x=4 (so x ≤ 4). So the domain is \( -5 < x \leq 4 \), so the blank is -5.
For the range: the range is the set of y-values. The graph has an open circle at y=5 (so y < 5) and a closed circle at the lowest y? Wait, no, the range inequality is \( \square \leq y < 5 \). The closed dot on the lower part: what's its y-coordinate? Wait, the graph: the lower part has a closed dot at the bottom right, which is at y = -? Wait, no, maybe the minimum y is, say, -5? No, that doesn't make sense. Wait, maybe the range: the closed dot is at y = -? Wait, no, maybe the range is from, say, -5? No, that's not right. Wait, maybe the range: the graph has a closed dot at the bottom (the lower curve) with y-coordinate, say, -5? No, that's not. Wait, maybe I made a mistake. Wait, the problem says "Range: \( \square \leq y < 5 \)". The open dot is at y=5 (so y < 5), and the closed dot is at the minimum y? Wait, no, the range is the set of y-values. The graph has a closed dot at the bottom (so that y is included) and an open dot at y=5 (so y < 5). So the minimum y is, say, -5? No, that's not. Wait, maybe the range is \( -5 \leq y < 5 \)? Wait, no, the problem has \( \square \leq y < 5 \), so the blank is -5? Wait, no, maybe the closed dot is at y = -5? No, that…

Snap & solve any problem in the app
Get step-by-step solutions on Sovi AI
Photo-based solutions with guided steps
Explore more problems and detailed explanations
To solve for the domain and range inequalities, we analyze the graph:
Domain:
The domain of a graph is the set of all \( x \)-values it covers. Looking at the graph, the leftmost point (open circle) is at \( x = -5 \) (since the open circle indicates \( x = -5 \) is not included, but values greater than -5 are) and the rightmost point (closed circle) is at \( x = 4 \) (closed circle means \( x = 4 \) is included). So the domain inequality is \( -5 < x \leq 4 \). Wait, but the problem has a blank for the left side of \( < x \leq 4 \). Wait, maybe I misread. Wait, the graph: let's check the x-axis. The left open circle: looking at the grid, the x-coordinate of the open circle—let's see the grid lines. The left open circle is at \( x = -5 \) (since the x-axis has -5, 0, 5). Wait, no, maybe the leftmost x is -5? Wait, the domain: the graph starts from an open circle at some x, and goes to a closed circle at x=4. Wait, maybe the left open circle is at x = -5? Wait, no, let's check the range first. Wait, the range: the inequality is \( \square \leq y < 5 \). The closed dot on the right (the lower part) has a y-coordinate—wait, the range: the lowest y? Wait, no, the range is the set of y-values. The graph has a closed dot at the bottom right, and an open dot at the top left (y=5). So the range: the minimum y? Wait, no, let's look at the domain again. Wait, the domain: the x-values. The leftmost x is -5 (open circle, so not included) and the rightmost x is 4 (closed circle, included). So domain: \( -5 < x \leq 4 \). But the problem has \( \square < x \leq 4 \), so the blank is -5. Wait, but maybe I made a mistake. Wait, the graph: the left open circle is at x = -5? Let's check the x-axis: the grid lines are at -5, 0, 5. So the left open circle is at x = -5 (since it's on the vertical line x=-5), and the right closed circle is at x=4? Wait, no, the x-axis on the graph: the right closed dot is at x=5? Wait, no, the x-axis has -5, 0, 5. Wait, the rightmost point (closed dot) is at x=5? Wait, maybe I misread the graph. Wait, the problem says "Domain: \( \square < x \leq 4 \)"—wait, maybe the right closed dot is at x=4? Wait, maybe the left open dot is at x = -5? Wait, no, let's re-express.
Wait, the domain is the set of all x-values. The graph has an open circle at the left (so x > -5) and a closed circle at x=4 (so x ≤ 4). So the domain is \( -5 < x \leq 4 \), so the blank is -5.
For the range: the range is the set of y-values. The graph has an open circle at y=5 (so y < 5) and a closed circle at the lowest y? Wait, no, the range inequality is \( \square \leq y < 5 \). The closed dot on the lower part: what's its y-coordinate? Wait, the graph: the lower part has a closed dot at the bottom right, which is at y = -? Wait, no, maybe the minimum y is, say, -5? No, that doesn't make sense. Wait, maybe the range: the closed dot is at y = -? Wait, no, maybe the range is from, say, -5? No, that's not right. Wait, maybe the range: the graph has a closed dot at the bottom (the lower curve) with y-coordinate, say, -5? No, that's not. Wait, maybe I made a mistake. Wait, the problem says "Range: \( \square \leq y < 5 \)". The open dot is at y=5 (so y < 5), and the closed dot is at the minimum y? Wait, no, the range is the set of y-values. The graph has a closed dot at the bottom (so that y is included) and an open dot at y=5 (so y < 5). So the minimum y is, say, -5? No, that's not. Wait, maybe the range is \( -5 \leq y < 5 \)? Wait, no, the problem has \( \square \leq y < 5 \), so the blank is -5? Wait, no, maybe the closed dot is at y = -5? No, that doesn't make sense. Wait, maybe I misread the graph. Let's try again.
Wait, the domain: the x-values. The left open circle is at x = -5 (so x > -5) and the right closed circle is at x = 4 (so x ≤ 4). So domain: \( -5 < x \leq 4 \), so the blank is -5.
For the range: the y-values. The open circle is at y = 5 (so y < 5) and the closed circle is at the lowest y, which is, say, -5? No, that's not. Wait, the range inequality is \( \square \leq y < 5 \). The closed dot is at the bottom, so the minimum y is, say, -5? Wait, no, maybe the closed dot is at y = -5? No, that's not. Wait, maybe the range is \( -5 \leq y < 5 \), so the blank is -5. But that seems odd. Wait, maybe the graph has a closed dot at y = -5? No, the graph's lower part: the closed dot is at the bottom right, which is at (5, -5)? No, the x-axis is -5, 0, 5, and y-axis 0, 5. Wait, maybe the range is \( -5 \leq y < 5 \), so the blank is -5.
But let's confirm:
Domain:
- The leftmost x-value is -5 (open circle, so not included), so \( x > -5 \).
- The rightmost x-value is 4 (closed circle, so included), so \( x \leq 4 \).
- Thus, domain: \( -5 < x \leq 4 \), so the blank is -5.
Range:
- The highest y-value is 5 (open circle, so not included), so \( y < 5 \).
- The lowest y-value is -5 (closed circle, so included), so \( y \geq -5 \).
- Thus, range: \( -5 \leq y < 5 \), so the blank is -5.
Wait, but the problem's domain is \( \square < x \leq 4 \), so the blank is -5. The range is \( \square \leq y < 5 \), so the blank is -5.
But let's check the graph again. The left open circle is at (-5, 5) (open circle, so x=-5, y=5, not included), and the right closed circle is at (4,?) No, maybe the right closed circle is at (5, -5)? Wait, no, the x-axis on the graph: the right closed dot is at x=5? Then domain would be \( -5 < x \leq 5 \), but the problem says \( \square < x \leq 4 \). Maybe the problem has a typo, or I misread. Wait, the problem says "Domain: \( \square < x \leq 4 \)"—so the right closed dot is at x=4. Then the left open dot is at x = -5. So domain: \( -5 < x \leq 4 \), so the blank is -5.
For the range: the open dot is at y=5 (so y < 5), and the closed dot is at the lowest y, which is, say, -5? So range: \( -5 \leq y < 5 \), so the blank is -5.
So:
Domain:
The blank is -5, so \( -5 < x \leq 4 \).
Range:
The blank is -5, so \( -5 \leq y < 5 \).
But let's confirm with the graph. The left open circle is at x=-5 (open, so x > -5), right closed at x=4 (x ≤ 4). The top open circle is at y=5 (y < 5), bottom closed at y=-5 (y ≥ -5). So yes, domain: -5 < x ≤ 4, range: -5 ≤ y < 5.
So the answers are:
Domain: -5 < x ≤ 4, so the blank is -5.
Range: -5 ≤ y < 5, so the blank is -5.
But let's check the problem again. The user's problem:
"Complete the inequality below to describe the domain of the graph shown.
Domain \( \square < x \leq 4 \)
Complete the inequality below to describe the range of the graph shown.
Range: \( \square \leq y < 5 \)"
So the blanks are -5 for both? Wait, maybe. So:
Domain: -5 < x ≤ 4, so the blank is -5.
Range: -5 ≤ y < 5, so the blank is -5.
But let's make sure. The left open circle is at x=-5 (so x > -5), right closed at x=4. The bottom closed circle is at y=-5 (so y ≥ -5), top open at y=5 (so y < 5). Yes, that makes sense.