QUESTION IMAGE
Question
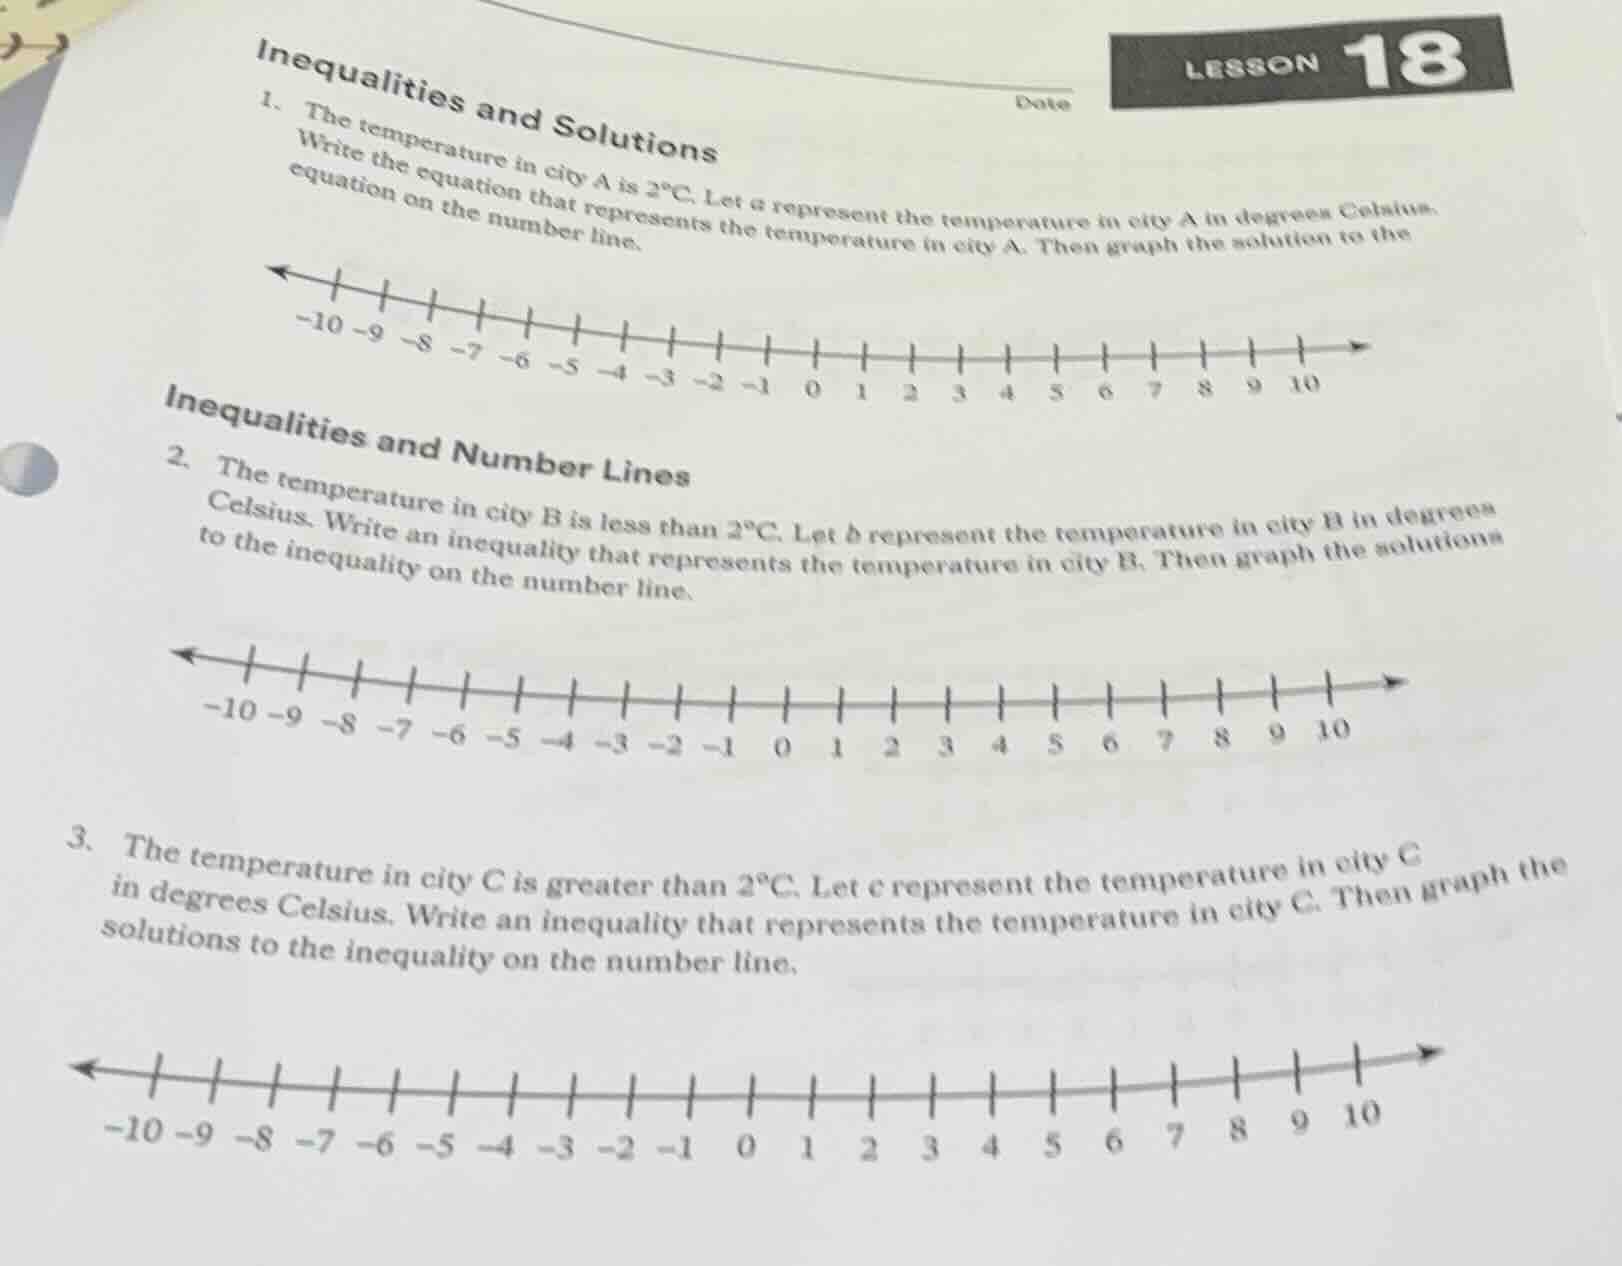
inequalities and solutions
- the temperature in city a is 2°c. let a represent the temperature in city a in degrees celsius. write the equation that represents the temperature in city a. then graph the solution to the equation on the number line.
inequalities and number lines
- the temperature in city b is less than 2°c. let b represent the temperature in city b in degrees celsius. write an inequality that represents the temperature in city b. then graph the solutions to the inequality on the number line.
- the temperature in city c is greater than 2°c. let c represent the temperature in city c in degrees celsius. write an inequality that represents the temperature in city c. then graph the solutions to the inequality on the number line.
Step1: Define equation for City A
The temperature equals $2^\circ\text{C}$, so:
$a = 2$
Step2: Graph for City A
On the number line, plot a filled dot at $2$ (since the value is exactly equal to 2) with no arrow, as only the single value is a solution.
Step3: Define inequality for City B
Temperature is less than $2^\circ\text{C}$, so:
$b < 2$
Step4: Graph for City B
On the number line, plot an open dot at $2$ (since 2 is not included) and draw an arrow pointing left (towards smaller numbers) to show all values less than 2.
Step5: Define inequality for City C
Temperature is greater than $2^\circ\text{C}$, so:
$c > 2$
Step6: Graph for City C
On the number line, plot an open dot at $2$ (since 2 is not included) and draw an arrow pointing right (towards larger numbers) to show all values greater than 2.

Snap & solve any problem in the app
Get step-by-step solutions on Sovi AI
Photo-based solutions with guided steps
Explore more problems and detailed explanations
- Equation: $a = 2$; Graph: Filled dot at position 2 on the number line.
- Inequality: $b < 2$; Graph: Open dot at position 2, arrow pointing left.
- Inequality: $c > 2$; Graph: Open dot at position 2, arrow pointing right.