QUESTION IMAGE
Question
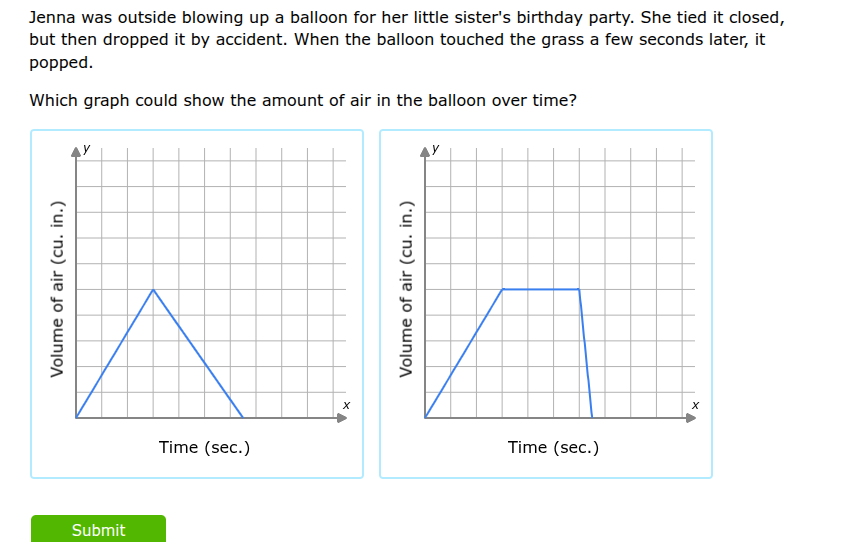
jenna was outside blowing up a balloon for her little sisters birthday party. she tied it closed, but then dropped it by accident. when the balloon touched the grass a few seconds later, it popped. which graph could show the amount of air in the balloon over time?
Step1: Analyze balloon filling phase
As Jenna blows up the balloon, the volume of air increases over time, so the graph rises from 0.
Step2: Analyze tied balloon phase
When the balloon is tied closed, the volume of air stays constant for a period (the time until it's dropped and pops), so the graph is a horizontal line.
Step3: Analyze popping phase
When the balloon pops, the volume of air drops to 0 instantly, so the graph has a sharp vertical drop to the x-axis.

Snap & solve any problem in the app
Get step-by-step solutions on Sovi AI
Photo-based solutions with guided steps
Explore more problems and detailed explanations
The right graph (horizontal plateau then sharp drop)