QUESTION IMAGE
Question
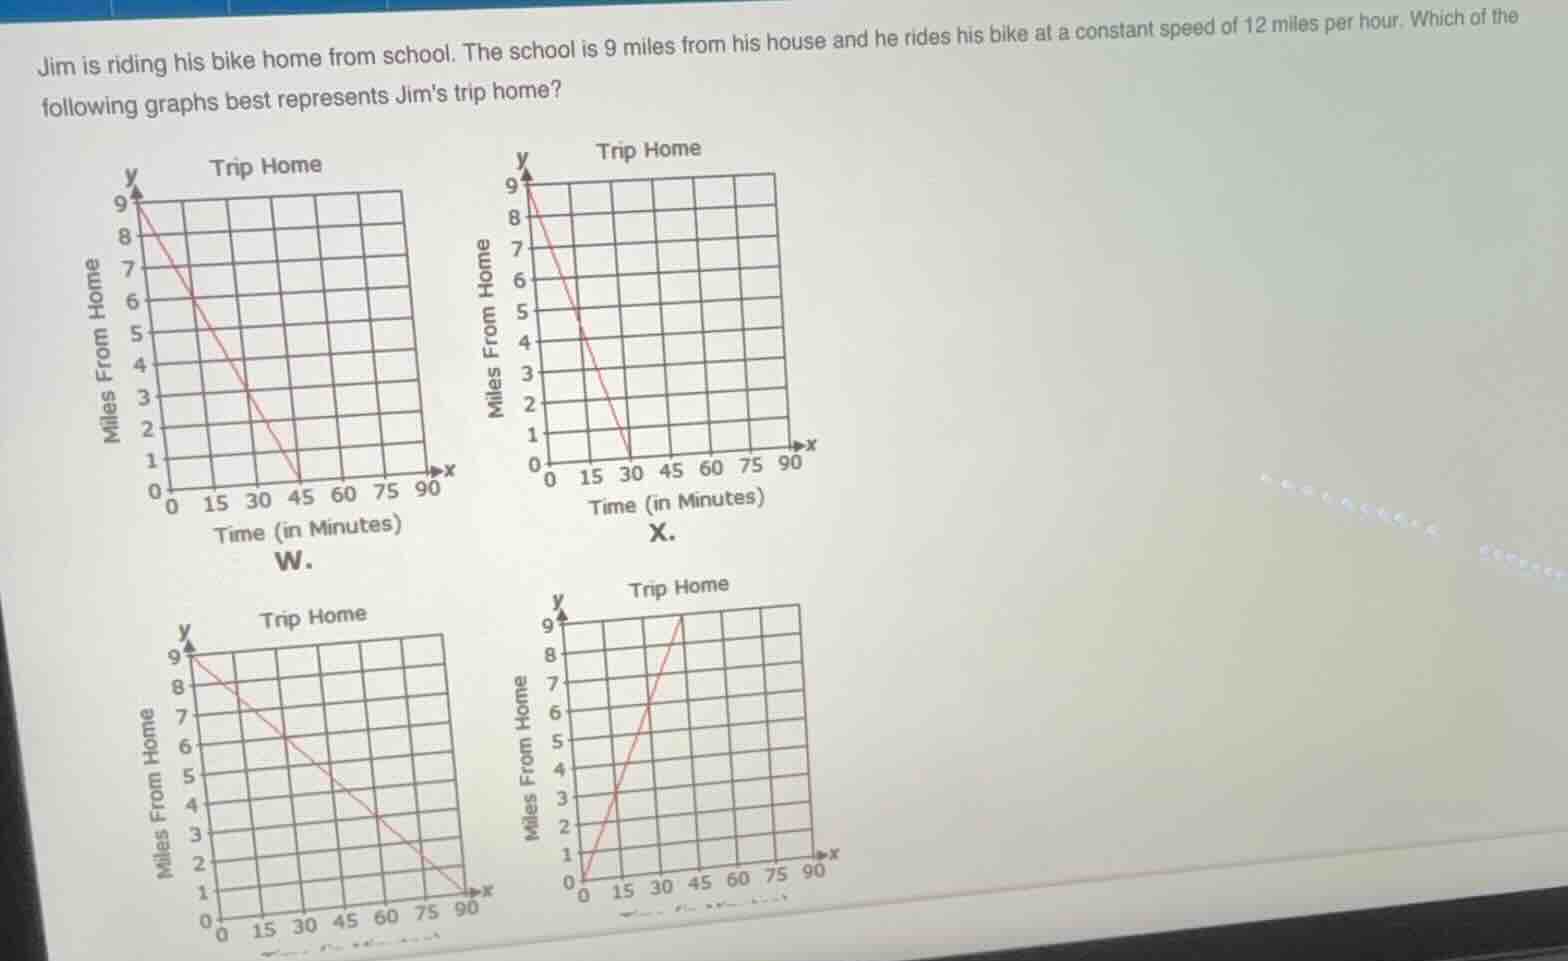
jim is riding his bike home from school. the school is 9 miles from his house and he rides his bike at a constant speed of 12 miles per hour. which of the following graphs best represents jims trip home?
Step1: Calculate time to reach home
First, convert speed to miles per minute: $12 \text{ mph} = \frac{12}{60} = 0.2 \text{ miles per minute}$. Then find time using $t = \frac{d}{v}$, where $d=9$ miles, $v=0.2$ miles/minute.
$\text{Time} = \frac{9}{0.2} = 45 \text{ minutes}$
Step2: Analyze graph properties
The starting distance from home is 9 miles (y-intercept = 9), and distance decreases to 0 at 45 minutes (x-intercept = 45). The graph must be a downward-sloping line from (0,9) to (45,0).

Snap & solve any problem in the app
Get step-by-step solutions on Sovi AI
Photo-based solutions with guided steps
Explore more problems and detailed explanations
Graph W