QUESTION IMAGE
Question
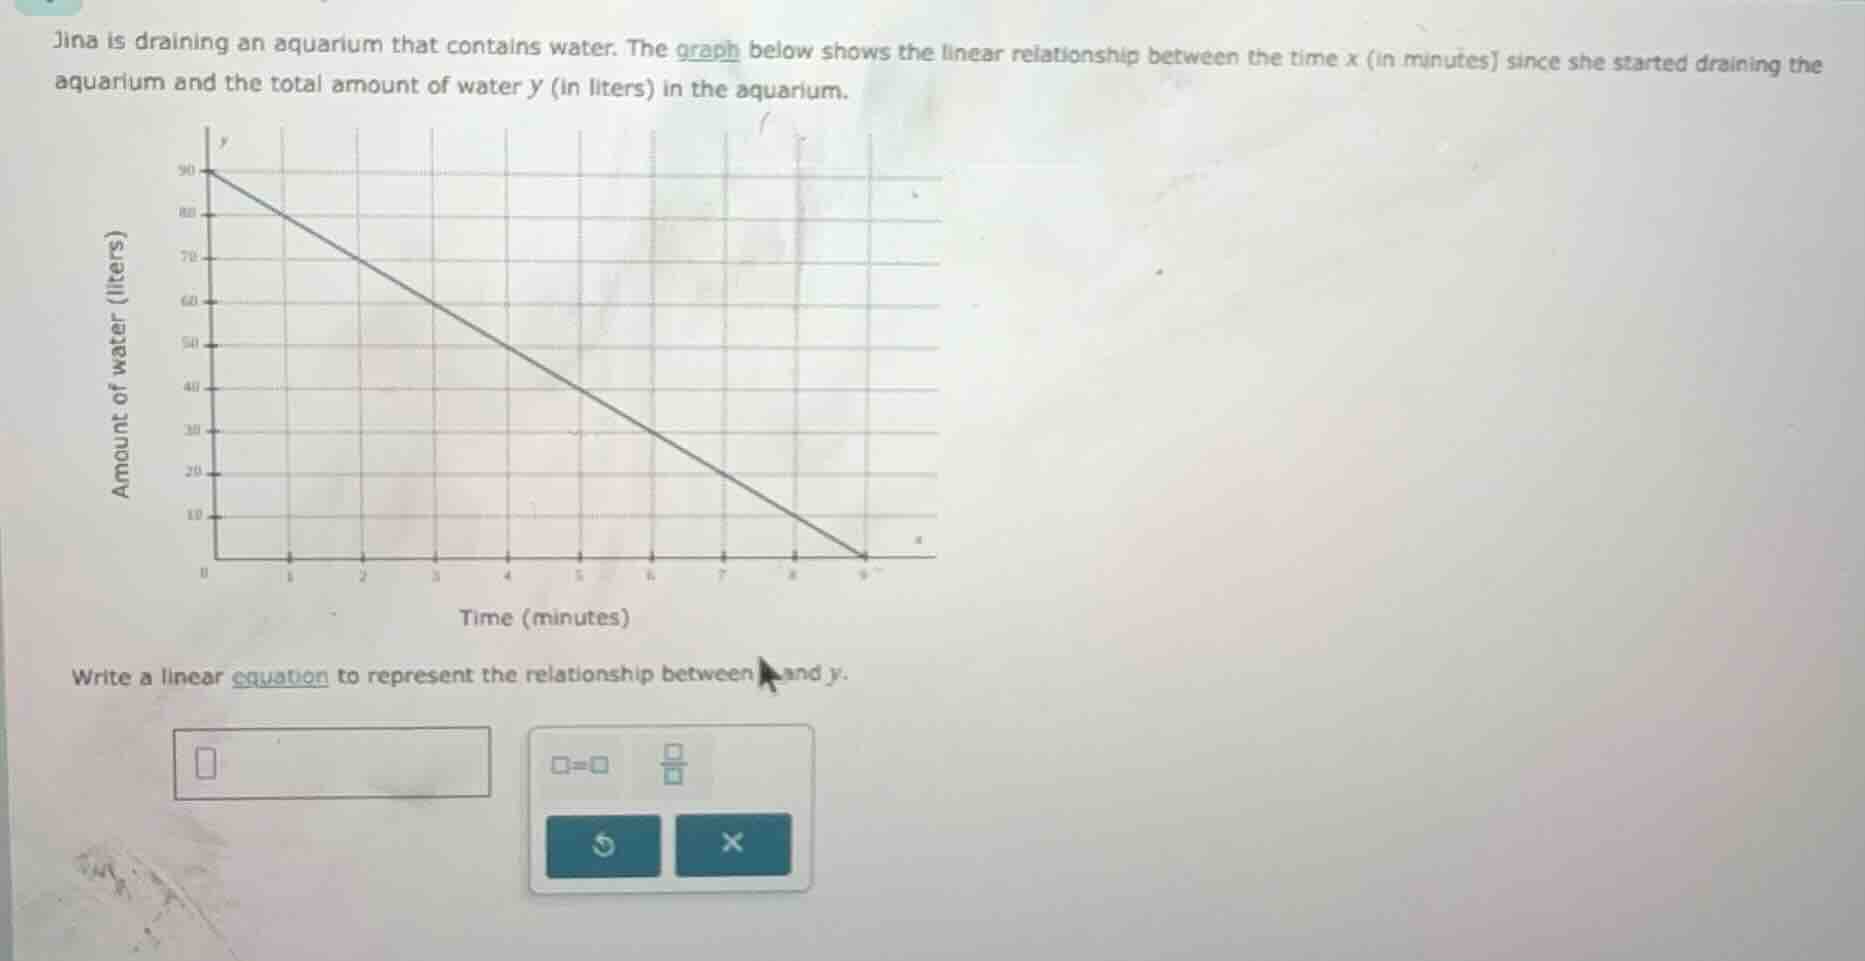
jina is draining an aquarium that contains water. the graph below shows the linear relationship between the time x (in minutes) since she started draining the aquarium and the total amount of water y (in liters) in the aquarium. write a linear equation to represent the relationship between x and y.
Step1: Identify intercepts
From the graph, the y-intercept $b = 90$ (when $x=0$, $y=90$), and the x-intercept is $x=9$ (when $y=0$).
Step2: Calculate slope $m$
Slope is $\frac{\text{change in } y}{\text{change in } x}$.
$m = \frac{0 - 90}{9 - 0} = -\frac{90}{9} = -10$
Step3: Write linear equation
Use slope-intercept form $y = mx + b$.
Substitute $m=-10$ and $b=90$:
$y = -10x + 90$

Snap & solve any problem in the app
Get step-by-step solutions on Sovi AI
Photo-based solutions with guided steps
Explore more problems and detailed explanations
$y = -10x + 90$