QUESTION IMAGE
Question
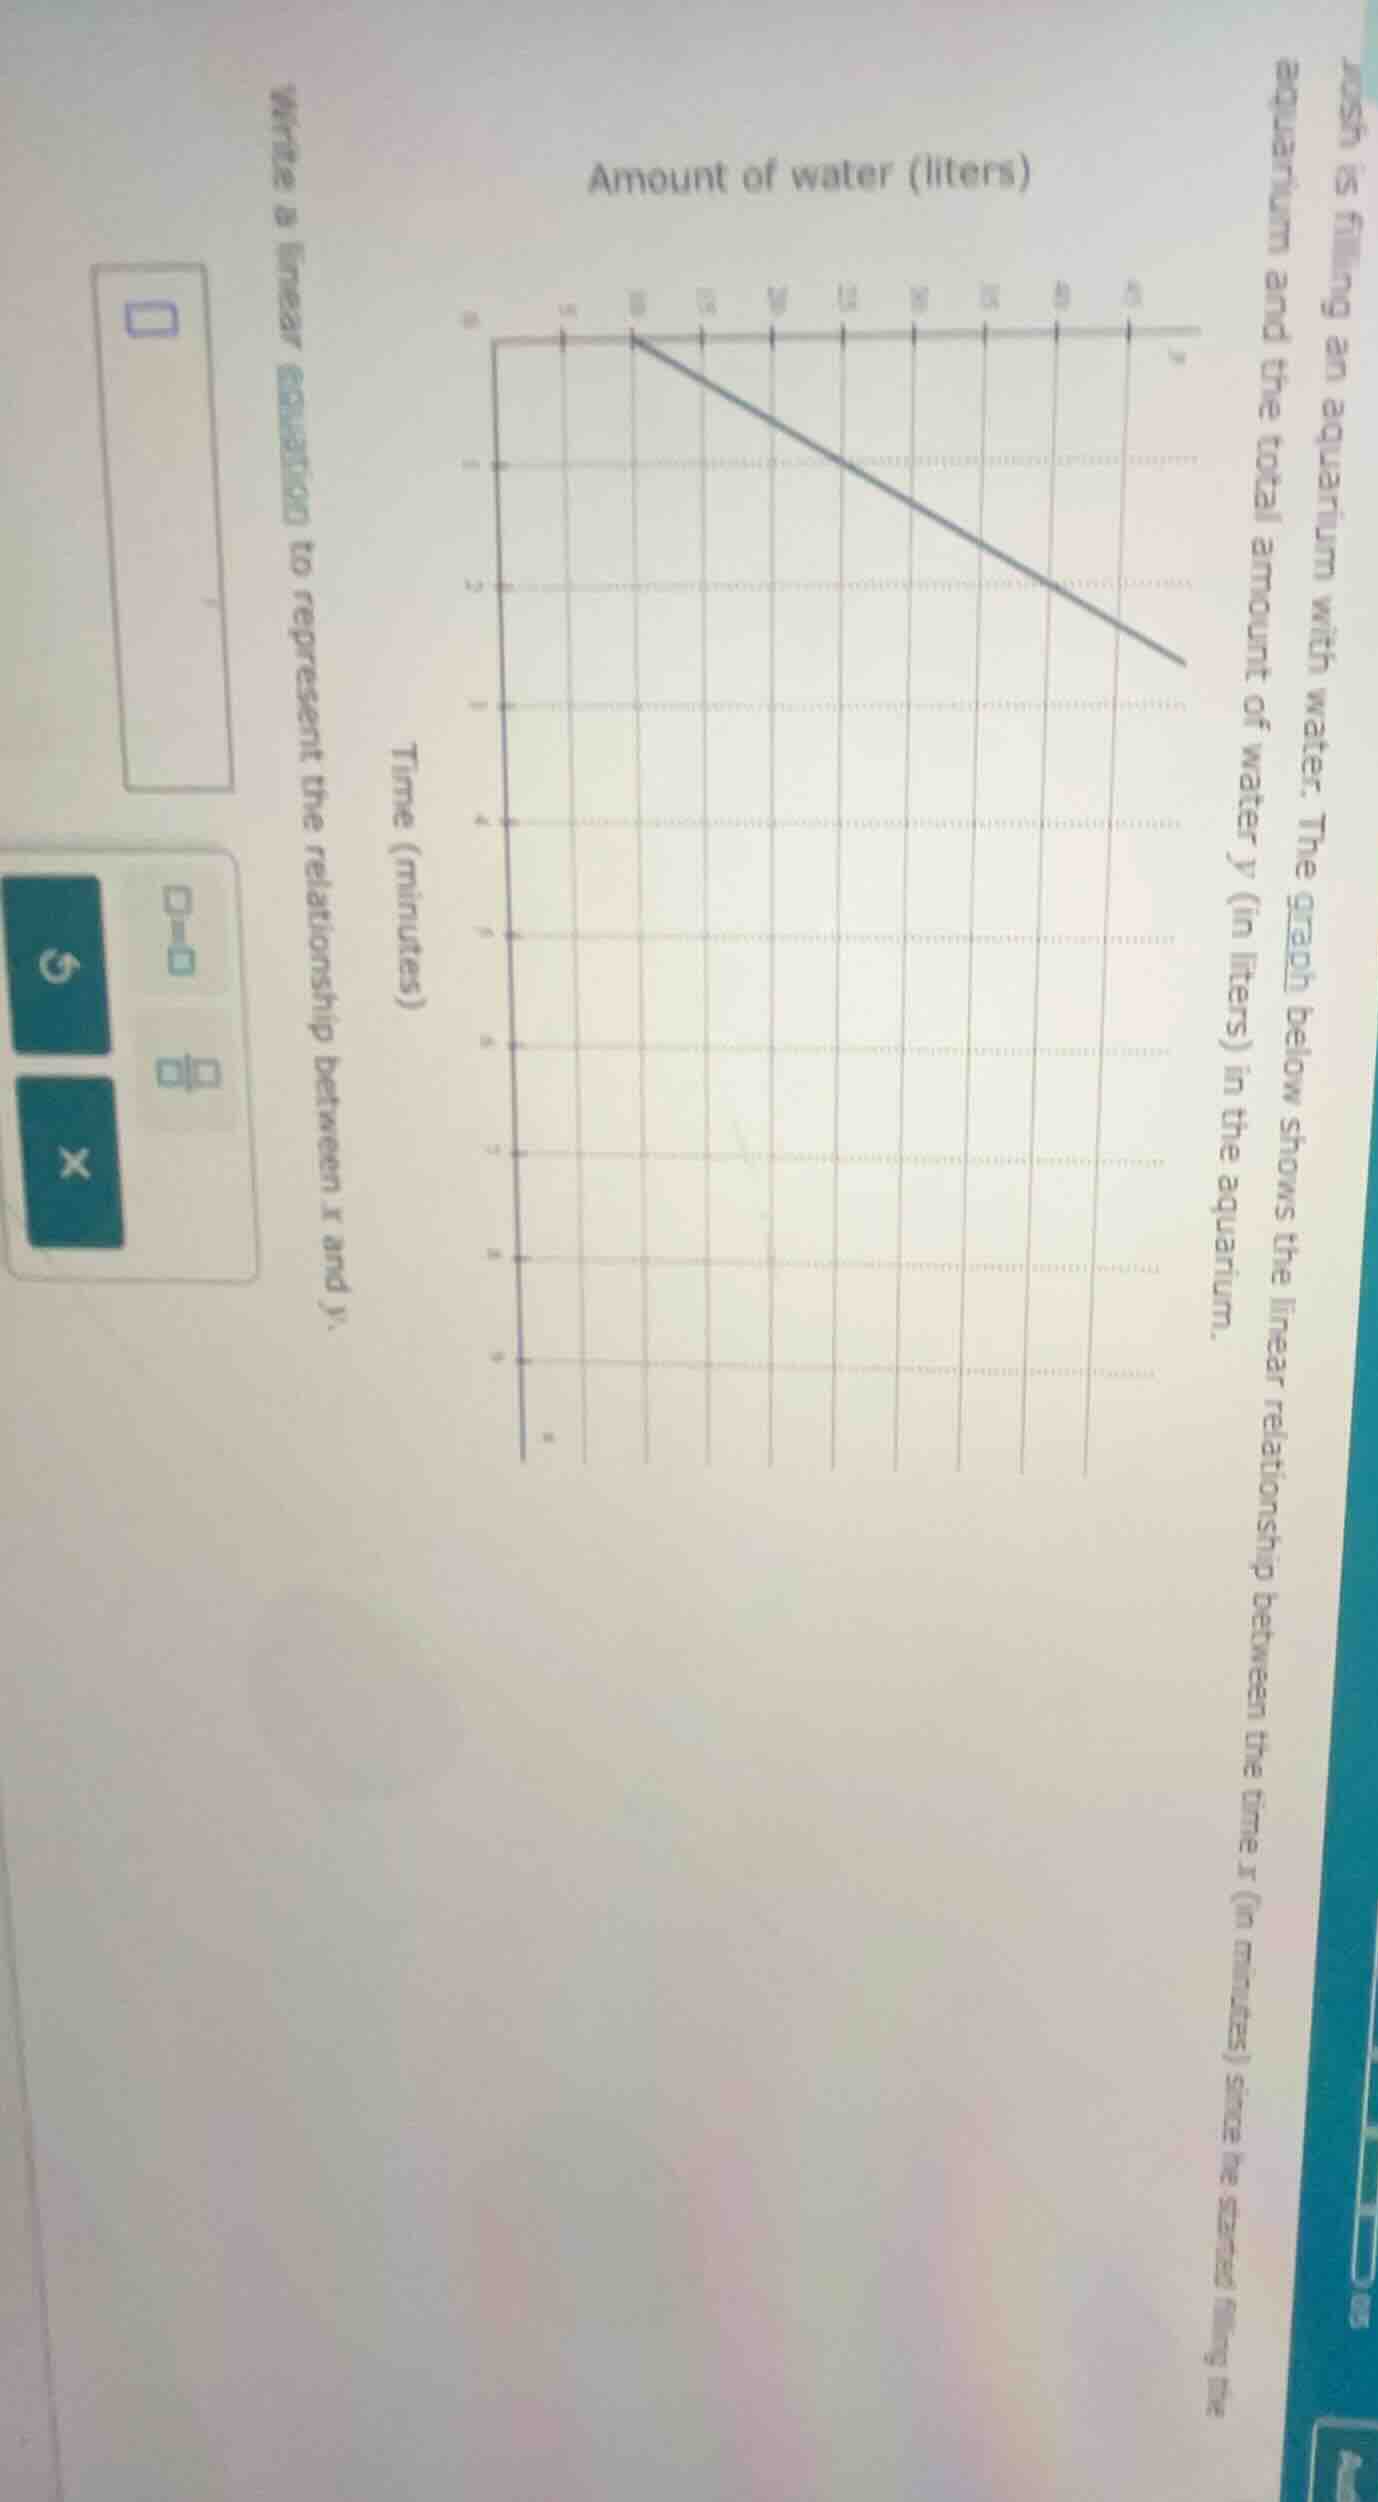
josh is filling an aquarium with water. the graph below shows the linear relationship between the time x (in minutes) since he started filling the aquarium and the total amount of water y (in liters) in the aquarium.
write a linear equation to represent the relationship between x and y.
Step1: Identify two points on the line
From the graph, let's assume two points. Let's say at \( x = 0 \) (time = 0 minutes), the amount of water \( y \) is, let's check the y - axis. Wait, maybe the graph has a y - intercept. Wait, maybe the initial point (when \( x = 0 \)) is \( (0, 60) \) and another point, say when \( x = 10 \), \( y = 40 \)? Wait, no, maybe the slope calculation. Wait, let's re - examine. Wait, the problem is about filling an aquarium? Wait, no, the graph seems to have a negative slope? Wait, maybe it's a typo, maybe it's draining? Wait, the user says "Josh is filling an aquarium", but the graph has a negative slope. Maybe it's a mistake, but let's proceed. Let's take two points. Let's assume the line passes through \( (0, 60) \) and \( (10, 40) \).
Step2: Calculate the slope \( m \)
The formula for slope \( m=\frac{y_2 - y_1}{x_2 - x_1} \). Let \( (x_1,y_1)=(0,60) \) and \( (x_2,y_2)=(10,40) \). Then \( m=\frac{40 - 60}{10 - 0}=\frac{- 20}{10}=- 2 \). Wait, but if it's filling, slope should be positive. Maybe the graph is mis - labeled. Alternatively, maybe the points are \( (0, 0) \) and \( (10, 60) \)? No, the user's graph: let's look at the axes. The x - axis is time (minutes), y - axis is amount of water (liters). Let's assume the correct two points. Let's say when \( x = 0 \), \( y = 0 \) (starts empty) and when \( x = 10 \), \( y = 60 \). Then slope \( m=\frac{60 - 0}{10 - 0}=6 \). But the original graph in the problem (from the user's image) - maybe the correct points are \( (0, 60) \) and \( (10, 40) \), but that would be draining. Wait, maybe the problem is about draining. Anyway, let's use the slope - intercept form \( y=mx + b \), where \( b \) is the y - intercept.
Wait, maybe the correct points are \( (0, 60) \) (when \( x = 0 \), \( y = 60 \)) and \( (10, 40) \). Then slope \( m=\frac{40 - 60}{10 - 0}=- 2 \). The y - intercept \( b \) is 60 (when \( x = 0 \), \( y = 60 \)). So the equation is \( y=-2x + 60 \). Wait, but if it's filling, slope should be positive. Maybe the graph is reversed. Alternatively, maybe the x - axis is time and y - axis is amount. Let's assume the correct two points. Let's say the line passes through \( (0, 0) \) and \( (10, 60) \), then slope \( m = 6 \), and equation \( y = 6x \). But the user's graph is not clear. Wait, maybe the intended problem is that at \( x = 0 \), \( y = 60 \) and at \( x = 10 \), \( y = 40 \), so slope \( m=-2 \), y - intercept \( b = 60 \), so equation \( y=-2x + 60 \).

Snap & solve any problem in the app
Get step-by-step solutions on Sovi AI
Photo-based solutions with guided steps
Explore more problems and detailed explanations
\( y=-2x + 60 \) (assuming the two points \( (0,60) \) and \( (10,40) \)) or if it's filling, maybe a positive slope. But based on the graph's negative slope, the linear equation is \( y=-2x + 60 \) (the values may vary depending on the exact graph, but the process is to find two points, calculate slope, then use slope - intercept form \( y = mx + b \)).