QUESTION IMAGE
Question
jump to level 1
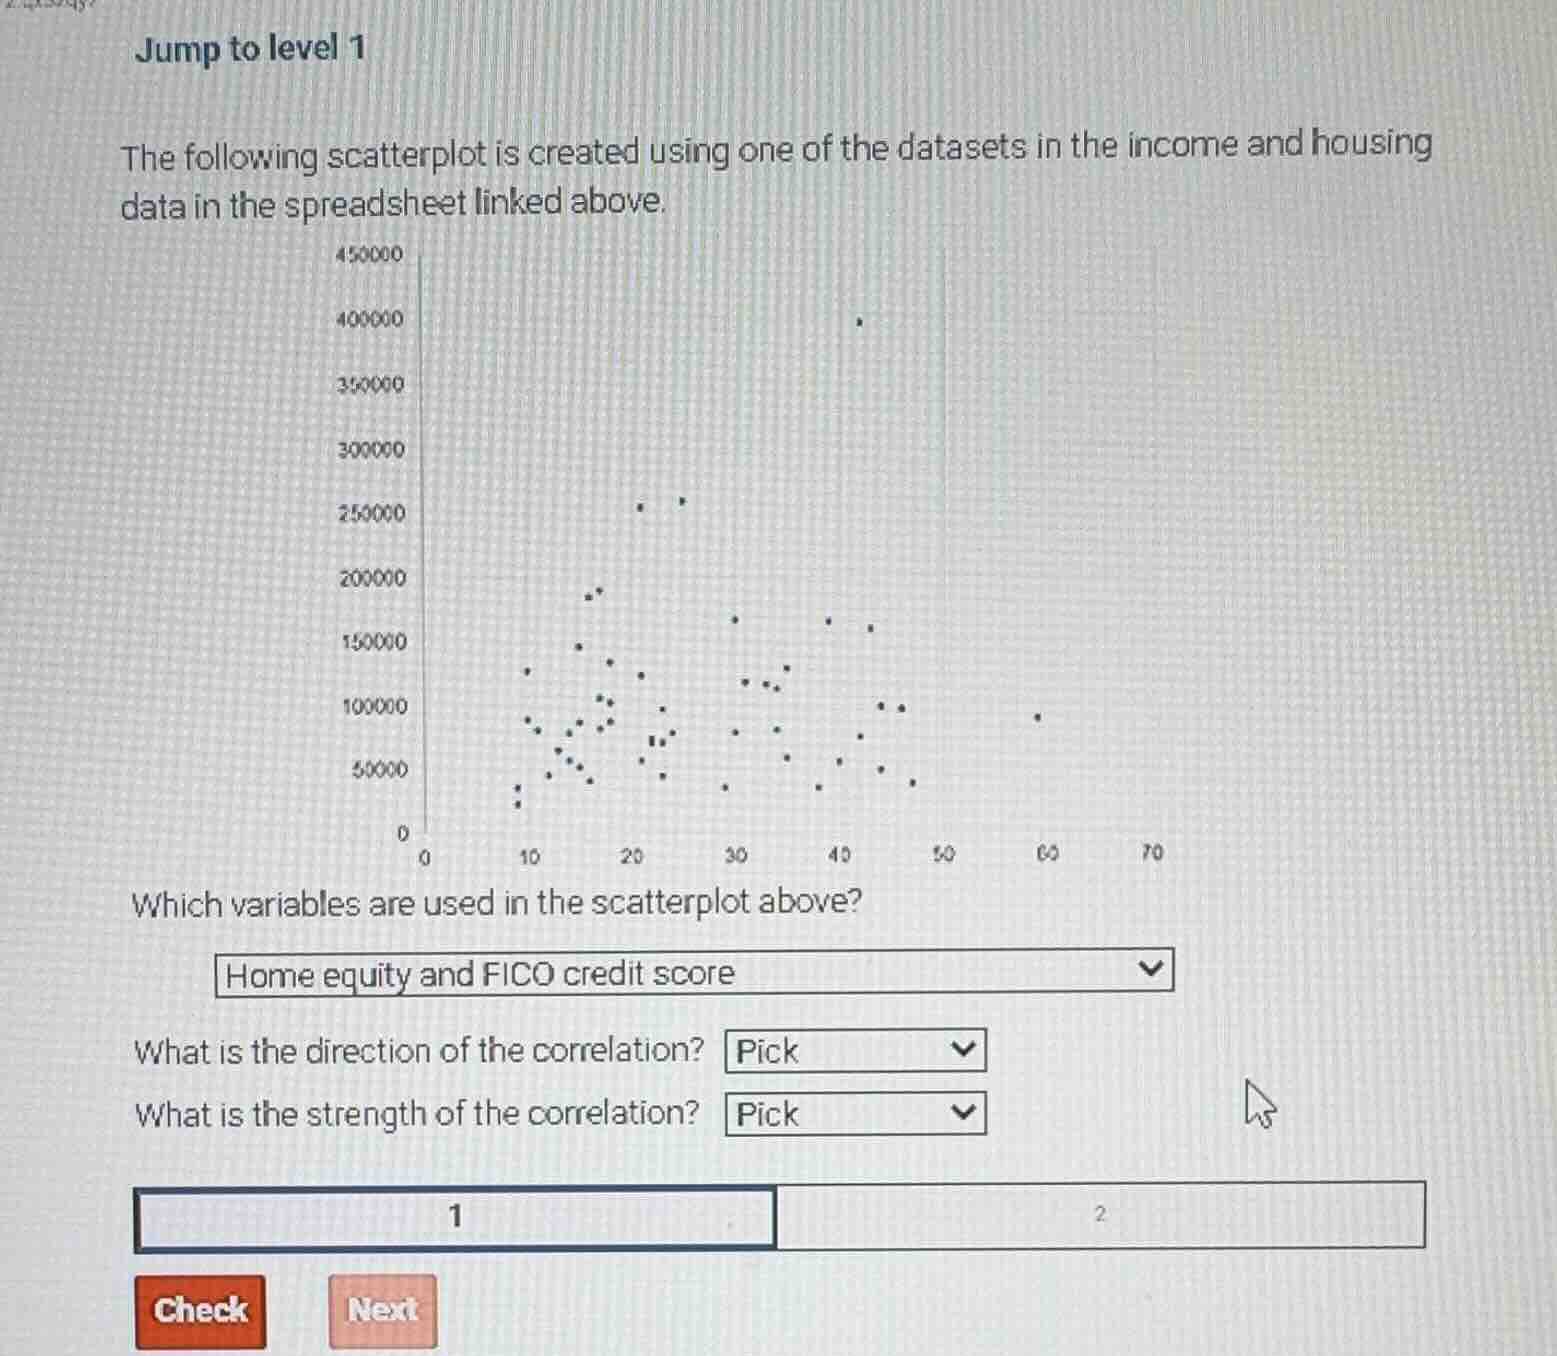
the following scatterplot is created using one of the datasets in the income and housing
data in the spreadsheet linked above.
which variables are used in the scatterplot above?
home equity and fico credit score
what is the direction of the correlation? pick
what is the strength of the correlation? pick
Brief Explanations
- For correlation direction: As the x-axis variable increases, the y-axis variable tends to decrease, showing a negative relationship.
- For correlation strength: The points are loosely scattered rather than tightly clustered along a clear line, indicating a weak relationship.

Snap & solve any problem in the app
Get step-by-step solutions on Sovi AI
Photo-based solutions with guided steps
Explore more problems and detailed explanations
What is the direction of the correlation? Negative
What is the strength of the correlation? Weak