QUESTION IMAGE
Question
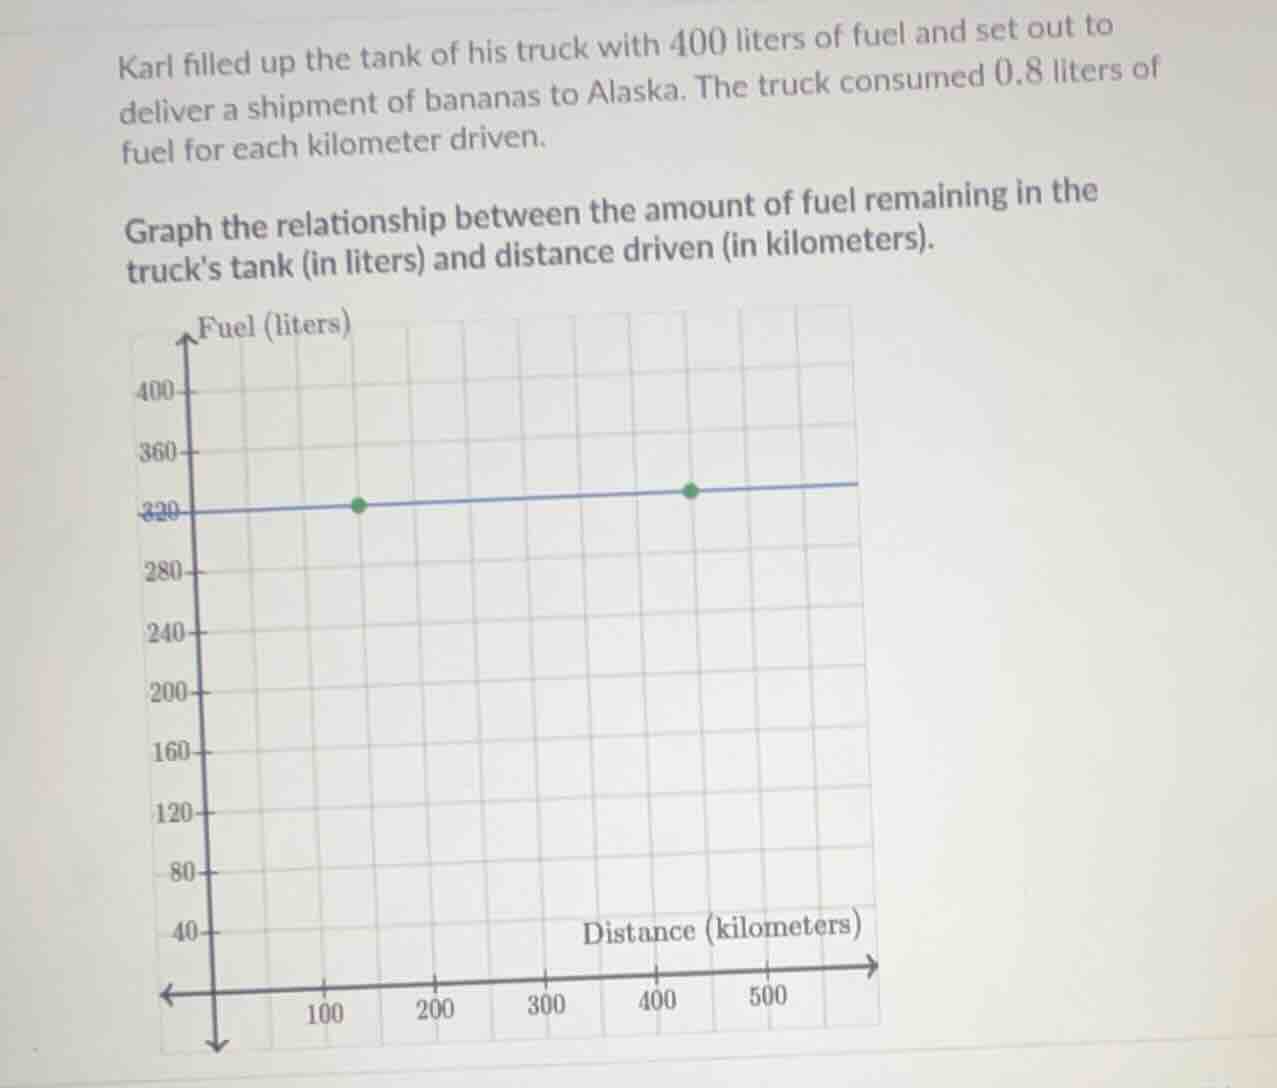
karl filled up the tank of his truck with 400 liters of fuel and set out to deliver a shipment of bananas to alaska. the truck consumed 0.8 liters of fuel for each kilometer driven. graph the relationship between the amount of fuel remaining in the trucks tank (in liters) and distance driven (in kilometers).
Step1: Define variables and equation
Let $d$ = distance driven (km), $F$ = remaining fuel (liters).
Initial fuel = 400 L, fuel use = 0.8 L/km.
Equation: $F = 400 - 0.8d$
Step2: Find intercepts (key points)
- Y-intercept (d=0): $F = 400 - 0.8(0) = 400$ → Point $(0, 400)$
- X-intercept (F=0): $0 = 400 - 0.8d$ → $d = \frac{400}{0.8} = 500$ → Point $(500, 0)$
Step3: Verify given points
For $d=150$: $F = 400 - 0.8(150) = 400 - 120 = 320$ → Point $(150, 320)$
For $d=450$: $F = 400 - 0.8(450) = 400 - 360 = 40$ → Note: The given horizontal line is incorrect; the correct line slopes downward.
Step4: Plot and draw the line
Plot $(0, 400)$, $(500, 0)$, and $(150, 320)$, then draw a straight line connecting them.

Snap & solve any problem in the app
Get step-by-step solutions on Sovi AI
Photo-based solutions with guided steps
Explore more problems and detailed explanations
The correct relationship is a straight line defined by $F = 400 - 0.8d$, passing through the points $(0, 400)$, $(150, 320)$, and $(500, 0)$ (sloping downward from left to right, not the horizontal line shown in the image).