QUESTION IMAGE
Question
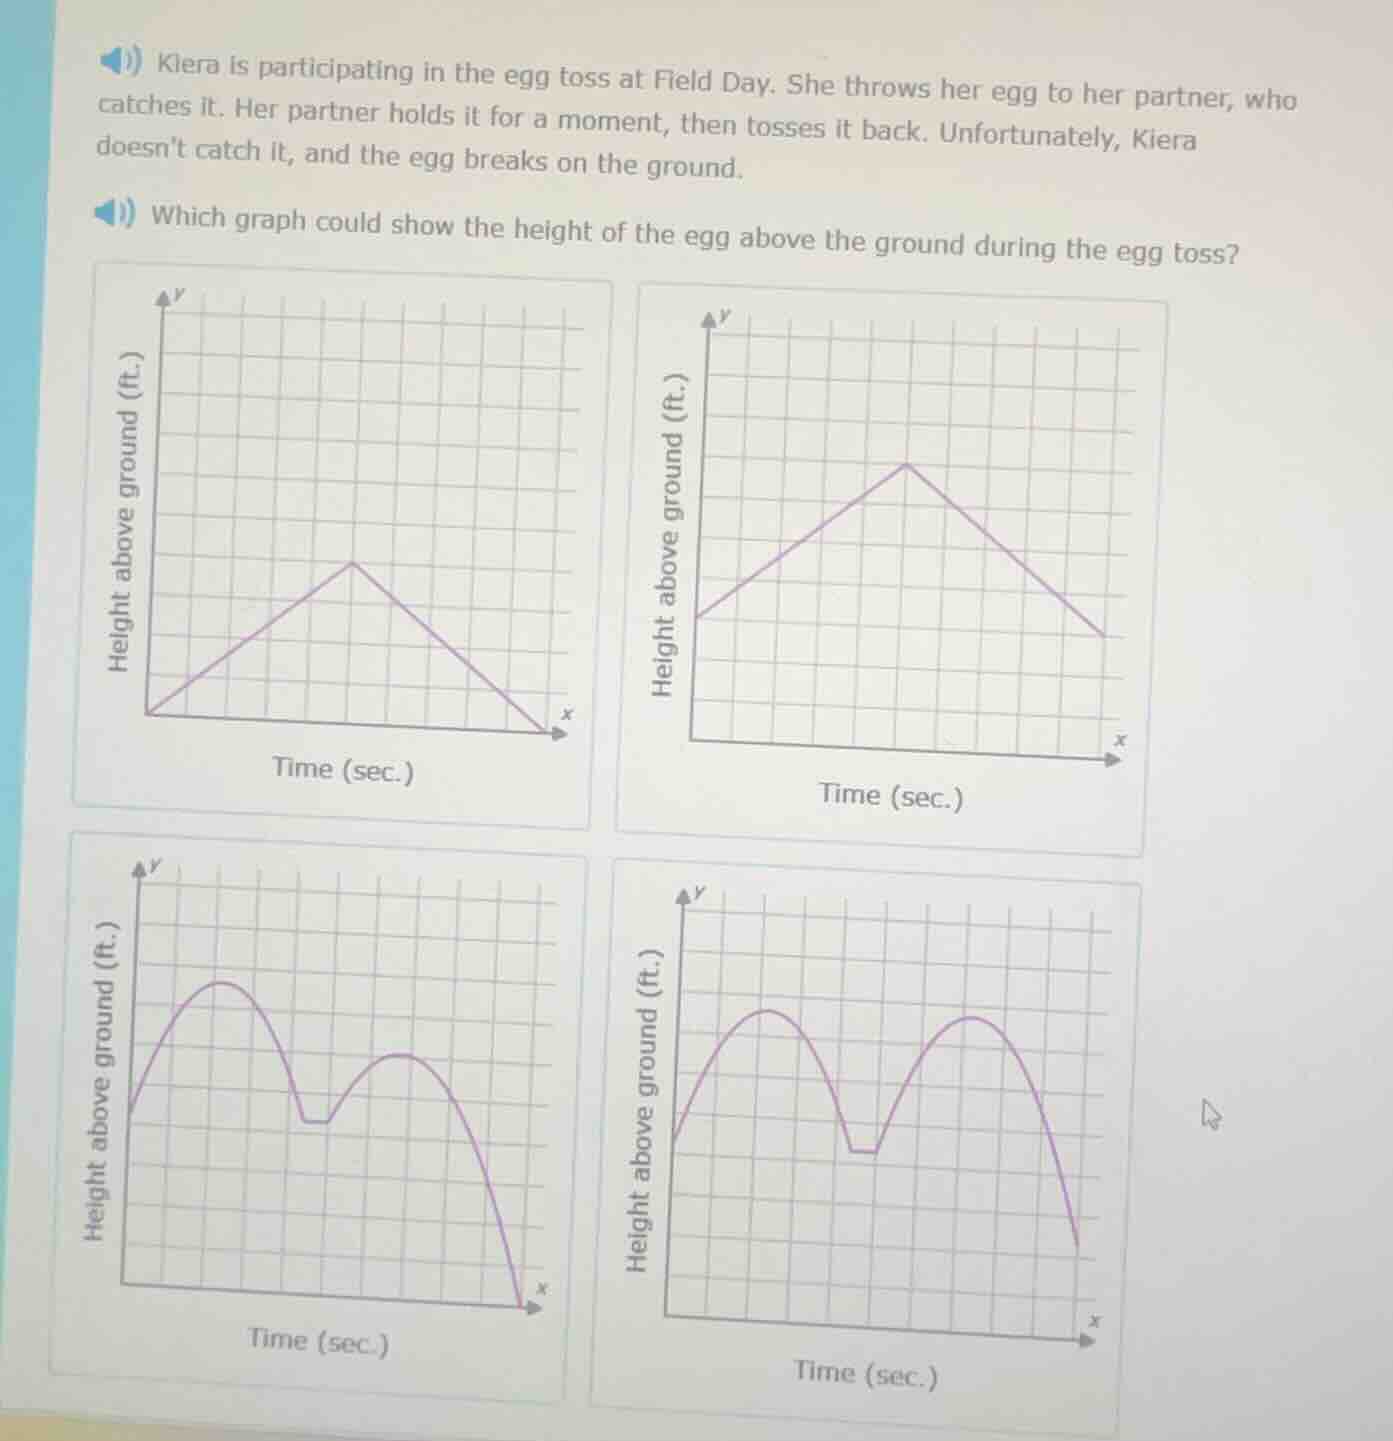
kiera is participating in the egg toss at field day. she throws her egg to her partner, who catches it. her partner holds it for a moment, then tosses it back. unfortunately, kiera doesnt catch it, and the egg breaks on the ground. which graph could show the height of the egg above the ground during the egg toss?
Step1: Analyze the egg toss process
The egg toss has three main phases: Kiera throws the egg (height increases then decreases as it reaches the partner), the partner holds it (height is constant for a moment, so a flat line), then the partner tosses it back (height increases then decreases, and finally the egg breaks on the ground (height goes to 0)).
Step2: Evaluate each graph
- First graph: Starts at 0, one peak (no hold phase), ends at 0. Doesn't match (needs a hold phase and a second toss).
- Second graph: One peak, no hold phase, ends at a positive height. Doesn't match (egg breaks, so should end at 0, and no hold).
- Third graph: Two peaks (first toss, hold, second toss), then height goes to 0 (egg breaks). Matches the process: first toss (up then down), hold (flat), second toss (up then down to 0).
- Fourth graph: Two peaks, ends at positive height. Doesn't match (egg breaks, so should end at 0).

Snap & solve any problem in the app
Get step-by-step solutions on Sovi AI
Photo-based solutions with guided steps
Explore more problems and detailed explanations
The third graph (the one with two peaks, a flat segment between them, and ending at 0 on the x - axis)