QUESTION IMAGE
Question
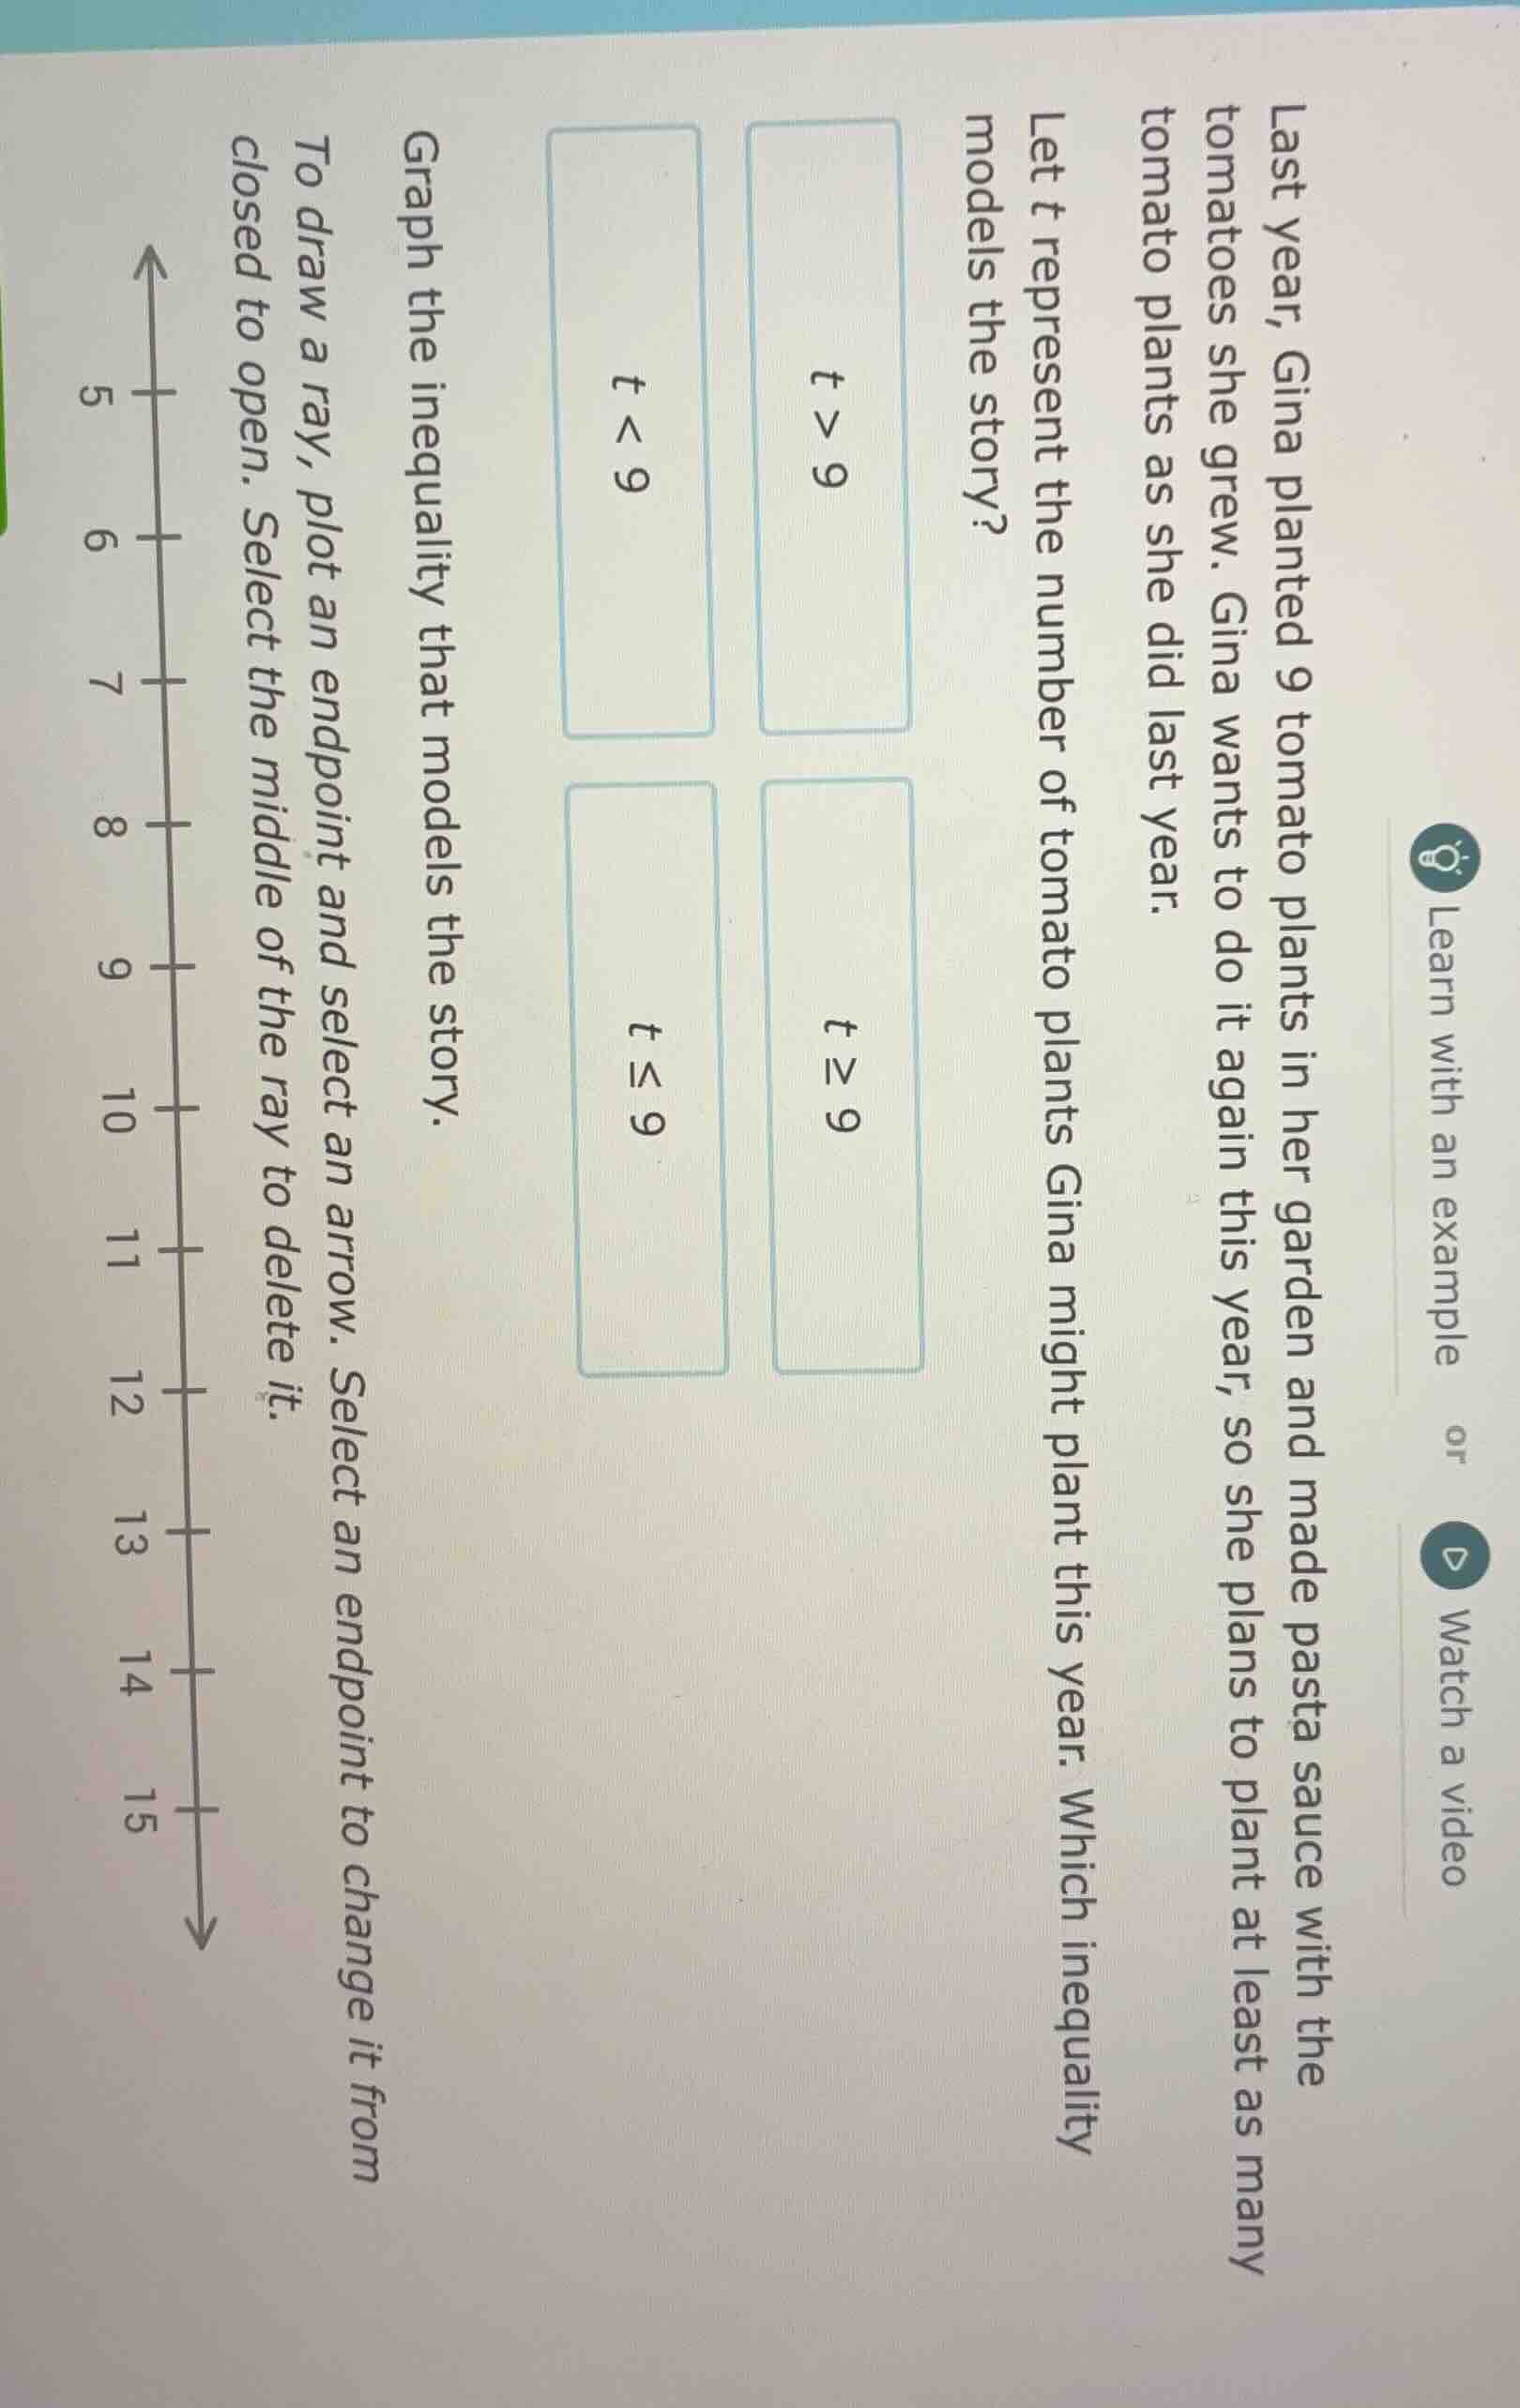
last year, gina planted 9 tomato plants in her garden and made pasta sauce with the tomatoes she grew. gina wants to do it again this year, so she plans to plant at least as many tomato plants as she did last year. let t represent the number of tomato plants gina might plant this year. which inequality models the story? \\( t > 9 \\) \\( t \geq 9 \\) \\( t < 9 \\) \\( t \leq 9 \\) graph the inequality that models the story. to draw a ray, plot an endpoint and select an arrow. select an endpoint to change it from closed to open. select the middle of the ray to delete it. \\(\
\\) learn with an example or watch a video
Step1: Interpret "at least as many"
The phrase "at least as many as 9" means $t$ can equal 9 or be greater than 9.
Step2: Match to inequality
This translates to the inequality $t \geq 9$.
Step3: Graph the inequality
- Plot a closed endpoint at $t=9$ (since 9 is included).
- Draw a ray starting at 9 and extending to the right (to represent values greater than 9).

Snap & solve any problem in the app
Get step-by-step solutions on Sovi AI
Photo-based solutions with guided steps
Explore more problems and detailed explanations
The inequality is $t \geq 9$.
To graph it:
- Place a closed dot at 9 on the number line.
- Draw an arrow pointing to the right from 9, covering all values 9 and above.