QUESTION IMAGE
Question
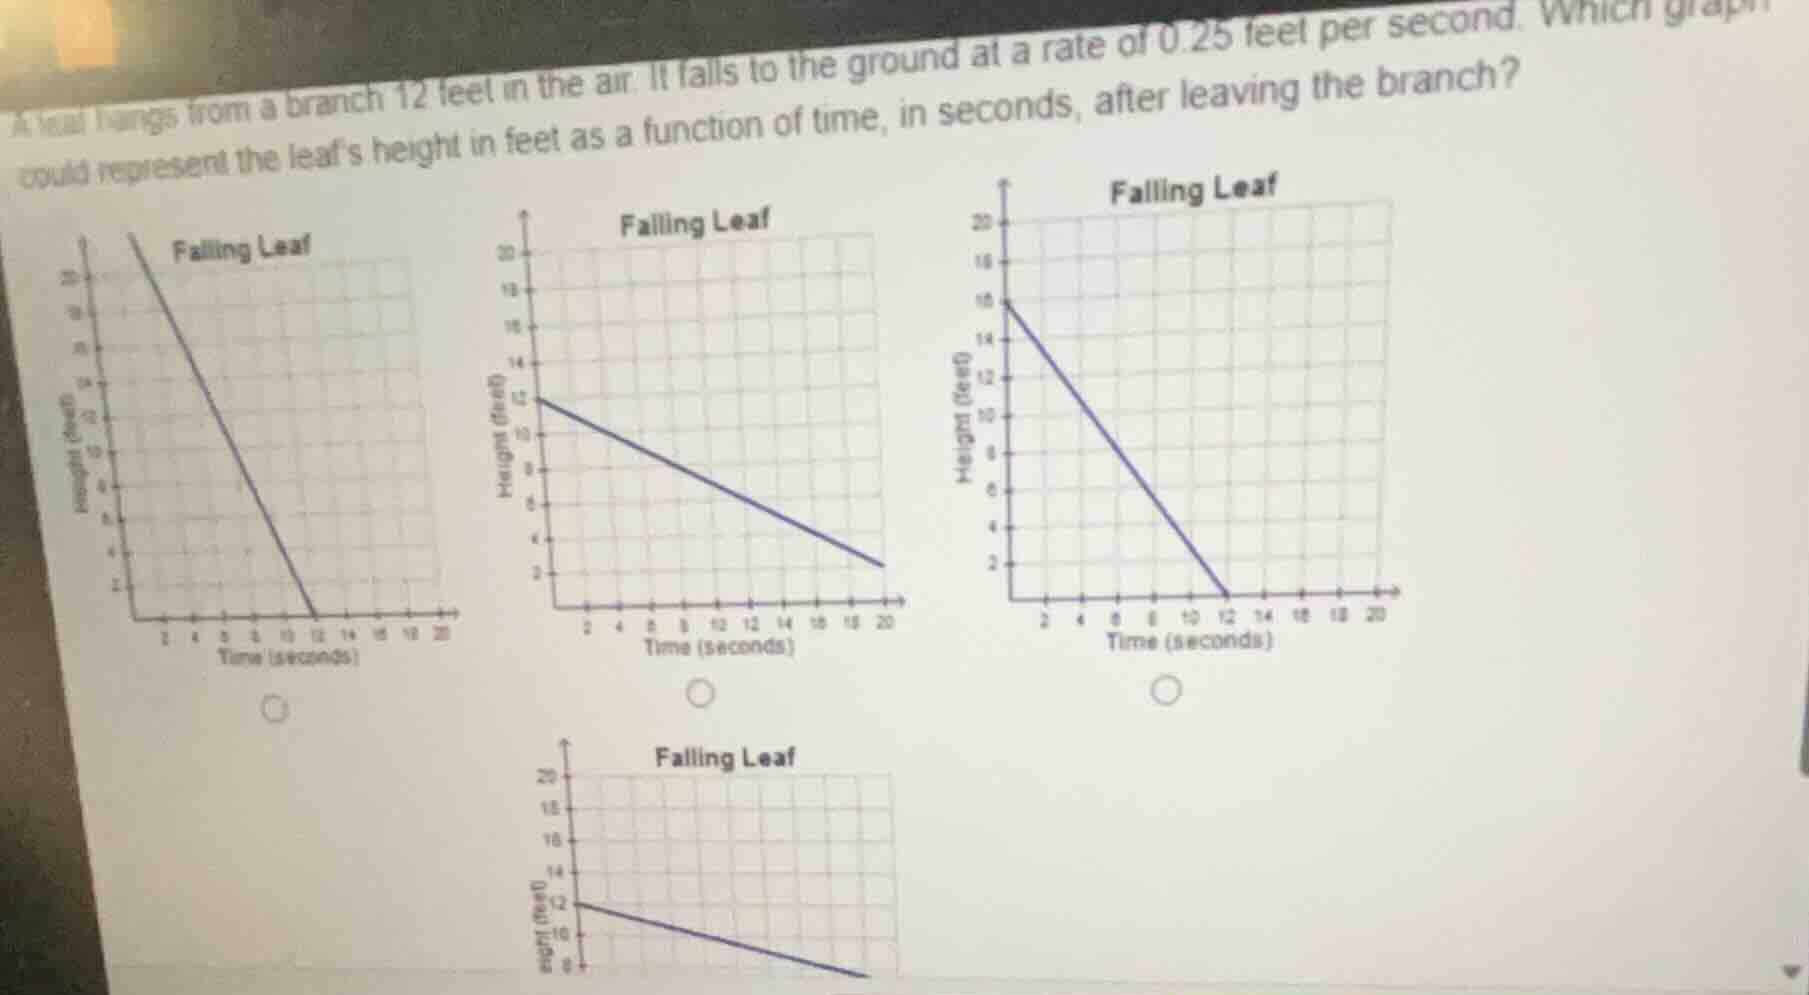
a leaf hangs from a branch 12 feet in the air. it falls to the ground at a rate of 0.25 feet per second. which graph could represent the leaf’s height in feet as a function of time, in seconds, after leaving the branch?
Step1: Define height function
Let $h(t)$ = height (ft), $t$ = time (sec). Initial height $h(0)=12$, rate = $-0.25$ ft/sec.
$$h(t) = 12 - 0.25t$$
Step2: Find time to reach ground
Set $h(t)=0$, solve for $t$:
$$0 = 12 - 0.25t$$
$$0.25t = 12$$
$$t = \frac{12}{0.25} = 48 \text{ seconds}$$
Step3: Match to graph
The graph starts at $(0,12)$ and decreases slowly, reaching $h=0$ at $t=48$. This matches the bottom graph (the one starting at 12, with the shallowest slope, extending to $t=20$ and beyond without hitting 0 yet, consistent with the slow rate).

Snap & solve any problem in the app
Get step-by-step solutions on Sovi AI
Photo-based solutions with guided steps
Explore more problems and detailed explanations
The bottom "Falling Leaf" graph (starting at (0,12) with the shallowest downward slope)