QUESTION IMAGE
Question
lesson 19 • session 3
reading and interpreting bar graphs continued
use the bar graph to solve problems 4–7. show your work.
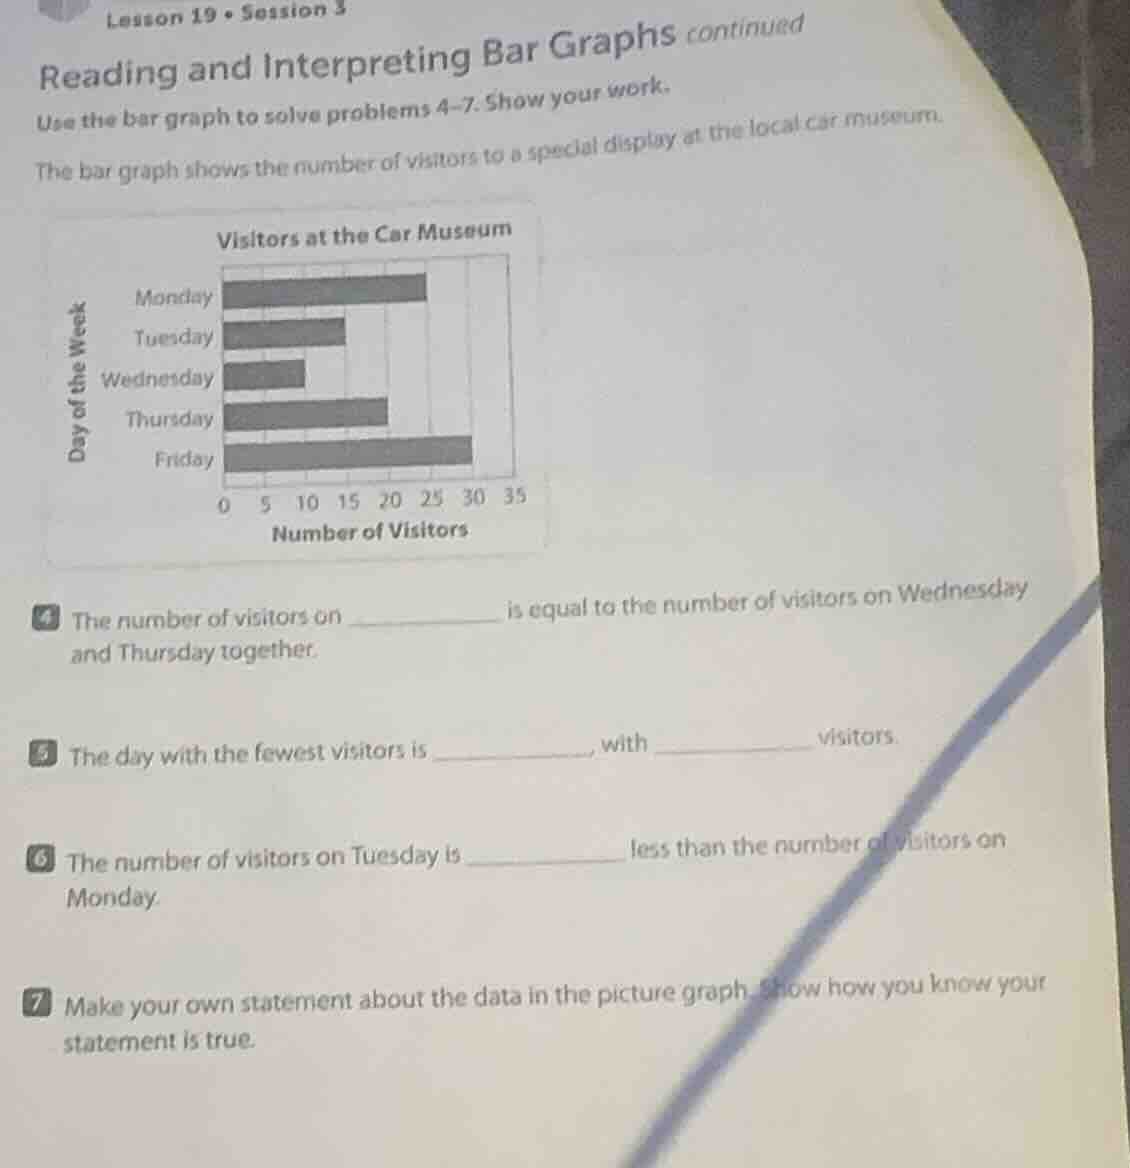
the bar graph shows the number of visitors to a special display at the local car museum.
visitors at the car museum
monday
tuesday
wednesday
thursday
friday
day of the week
0 5 10 15 20 25 30 35
number of visitors
4 the number of visitors on ______ is equal to the number of visitors on wednesday
and thursday together.
5 the day with the fewest visitors is ____, with ____ visitors.
6 the number of visitors on tuesday is ______ less than the number of visitors on
monday.
7 make your own statement about the data in the picture graph. show how you know your
statement is true.
Problem 4
Step1: Determine visitors on each day
From the bar graph:
- Wednesday: Let's assume Wednesday has 10 visitors (from the graph, the bar ends at 10).
- Thursday: Let's assume Thursday has 20 visitors (bar ends at 20).
- Sum of Wednesday and Thursday: \(10 + 20 = 30\)
- Now check which day has 30 visitors. Friday's bar ends at 30.
Step1: Analyze bar lengths
Look at the bar graph. The shortest bar is for Wednesday.
Step2: Determine number of visitors
The bar for Wednesday ends at 10 (assuming the scale: 0,5,10,15,20,25,30,35). So Wednesday has 10 visitors.
Step1: Find visitors on Monday and Tuesday
- Monday: Let's say Monday has 25 visitors (bar ends at 25).
- Tuesday: Let's say Tuesday has 15 visitors (bar ends at 15).
Step2: Calculate the difference
\(25 - 15 = 10\)

Snap & solve any problem in the app
Get step-by-step solutions on Sovi AI
Photo-based solutions with guided steps
Explore more problems and detailed explanations
Friday