QUESTION IMAGE
Question
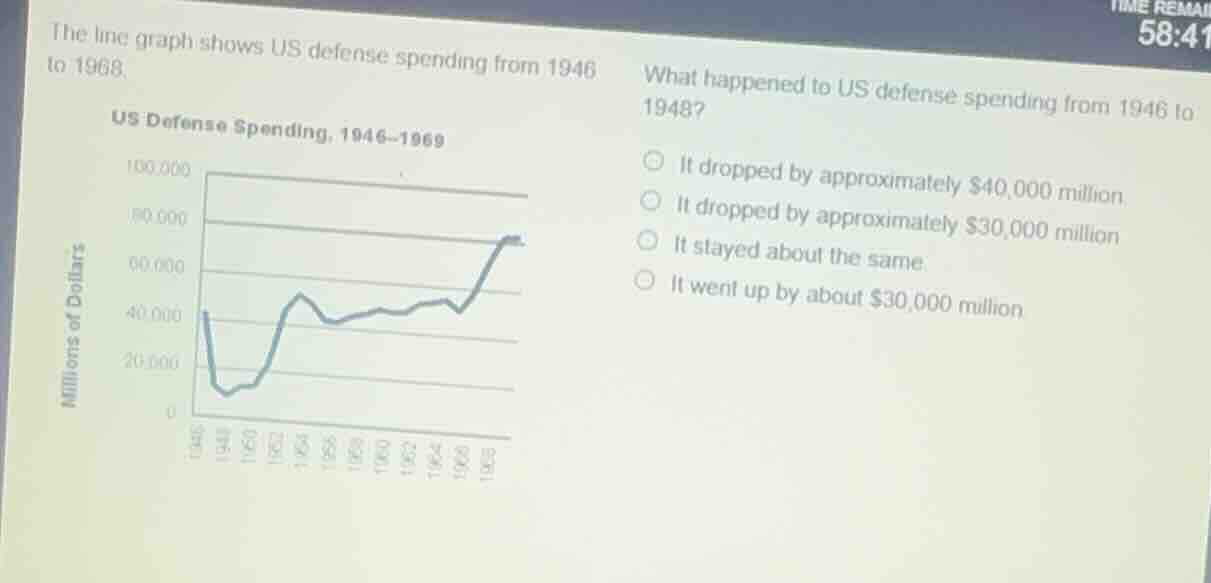
the line graph shows us defense spending from 1946 to 1968.
what happened to us defense spending from 1946 to 1948?
it dropped by approximately $40,000 million.
it dropped by approximately $30,000 million
it stayed about the same.
it went up by about $30,000 million
Brief Explanations
- Locate 1946 on the x-axis: the spending is ~$40,000 million.
- Locate 1948 on the x-axis: the spending is ~$10,000 million.
- Calculate the change: $40,000 - $10,000 = $30,000 million, meaning spending dropped by this amount.

Snap & solve any problem in the app
Get step-by-step solutions on Sovi AI
Photo-based solutions with guided steps
Explore more problems and detailed explanations
It dropped by approximately $30,000 million