QUESTION IMAGE
Question
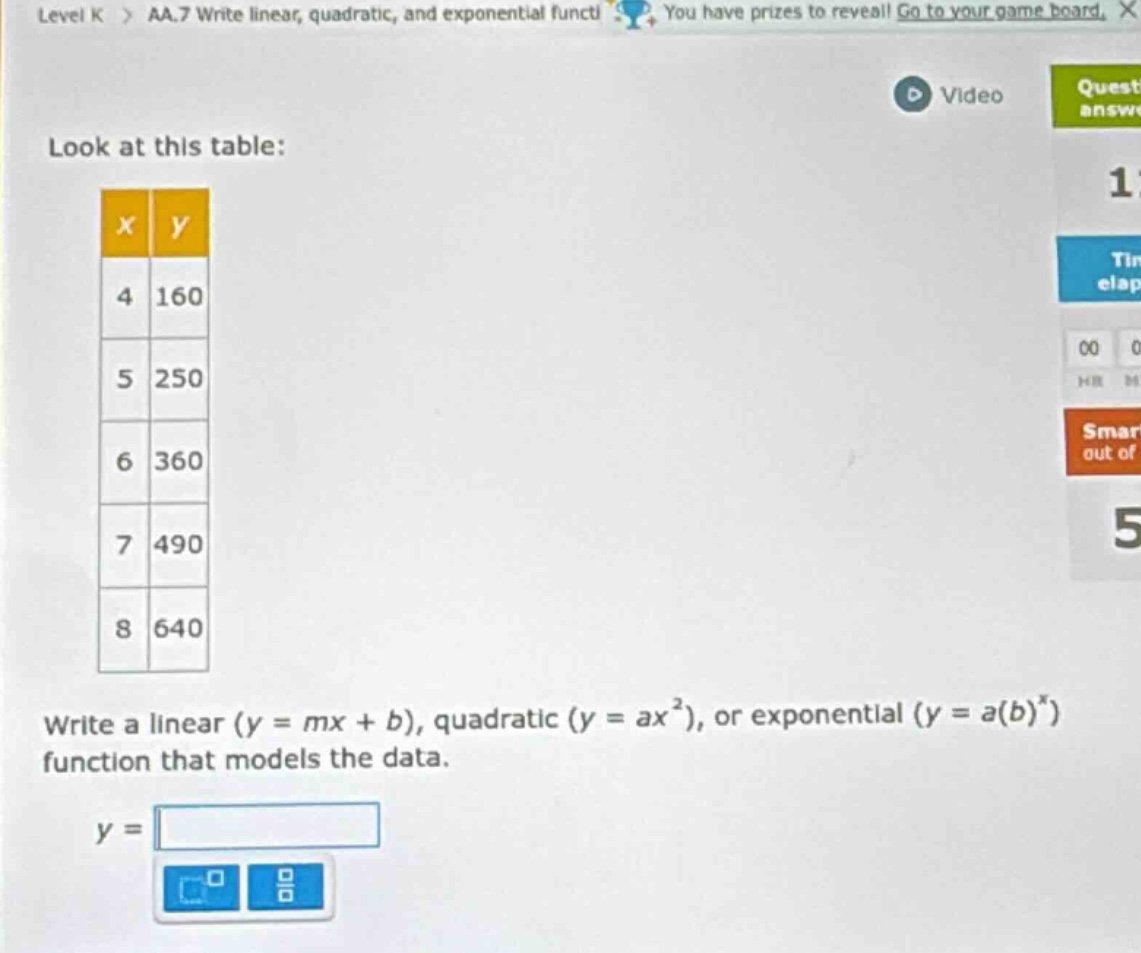
look at this table:
| x | y |
|---|---|
| 5 | 250 |
| 6 | 360 |
| 7 | 490 |
| 8 | 640 |
write a linear ($y = mx + b$), quadratic ($y = ax^2$), or exponential ($y = a(b)^x$) function that models the data.
$y = \square$
Step1: Check linear fit (constant slope)
Calculate slopes between points:
$\frac{250-160}{5-4}=90$, $\frac{360-250}{6-5}=110$, $\frac{490-360}{7-6}=130$, $\frac{640-490}{8-7}=150$
Slopes are not constant, so not linear.
Step2: Check quadratic fit (constant second difference)
First differences: $90, 110, 130, 150$
Second differences: $110-90=20$, $130-110=20$, $150-130=20$
Second differences are constant, so quadratic.
Step3: Solve for $a$ in $y=ax^2$
Use point $(4,160)$:
$160 = a(4)^2$
$160 = 16a$
$a = \frac{160}{16}=10$
Step4: Verify with another point
Use $(5,250)$: $y=10(5)^2=10*25=250$, which matches.
Use $(8,640)$: $y=10(8)^2=10*64=640$, which matches.

Snap & solve any problem in the app
Get step-by-step solutions on Sovi AI
Photo-based solutions with guided steps
Explore more problems and detailed explanations
$y=10x^2$