QUESTION IMAGE
Question
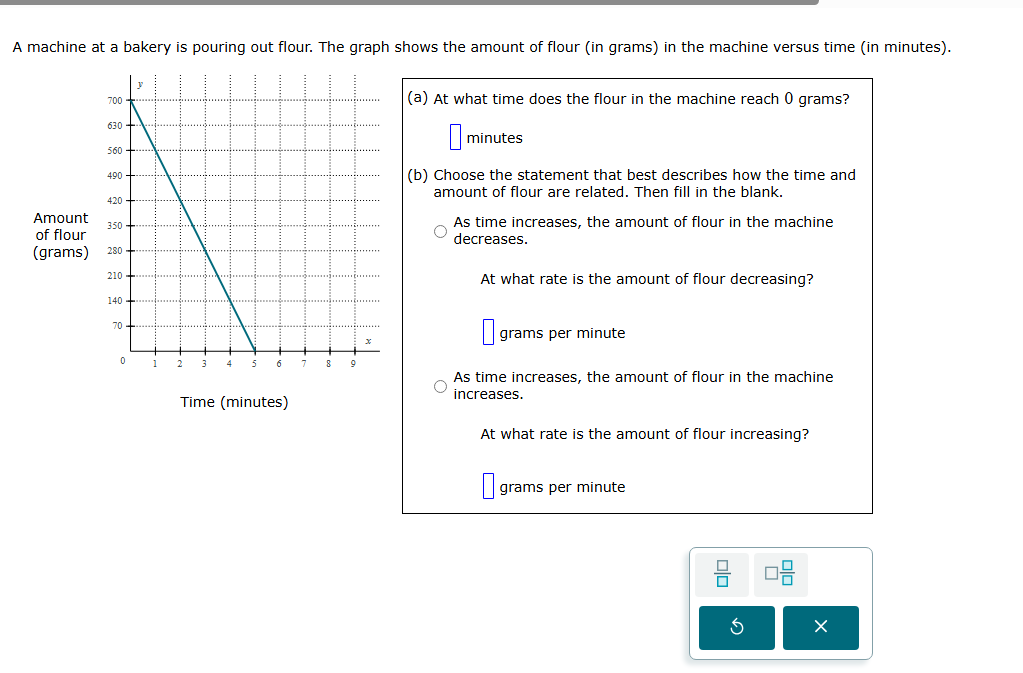
a machine at a bakery is pouring out flour. the graph shows the amount of flour in grams in the machine versus time in minutes.
(a) at what time does the flour in the machine reach 0 grams?
_____ minutes
(b) choose the statement that best describes how the time and amount of flour are related. then fill in the blank.
○ as time increases, the amount of flour in the machine decreases.
at what rate is the amount of flour decreasing?
_____ grams per minute
○ as time increases, the amount of flour in the machine increases.
at what rate is the amount of flour increasing?
_____ grams per minute
Step1: Find time for 0 flour
Locate where the line hits $y=0$ on the graph. The line intersects the x-axis at $x=5$.
Step2: Identify relationship direction
As time (x) increases, flour (y) drops from 700 to 0. So flour decreases.
Step3: Calculate rate of decrease
Rate = $\frac{\text{Change in flour}}{\text{Change in time}} = \frac{700 - 0}{5 - 0}$
$\frac{700}{5} = 140$

Snap & solve any problem in the app
Get step-by-step solutions on Sovi AI
Photo-based solutions with guided steps
Explore more problems and detailed explanations
(a) 5 minutes
(b) Selected statement: As time increases, the amount of flour in the machine decreases.
Rate: 140 grams per minute