QUESTION IMAGE
Question
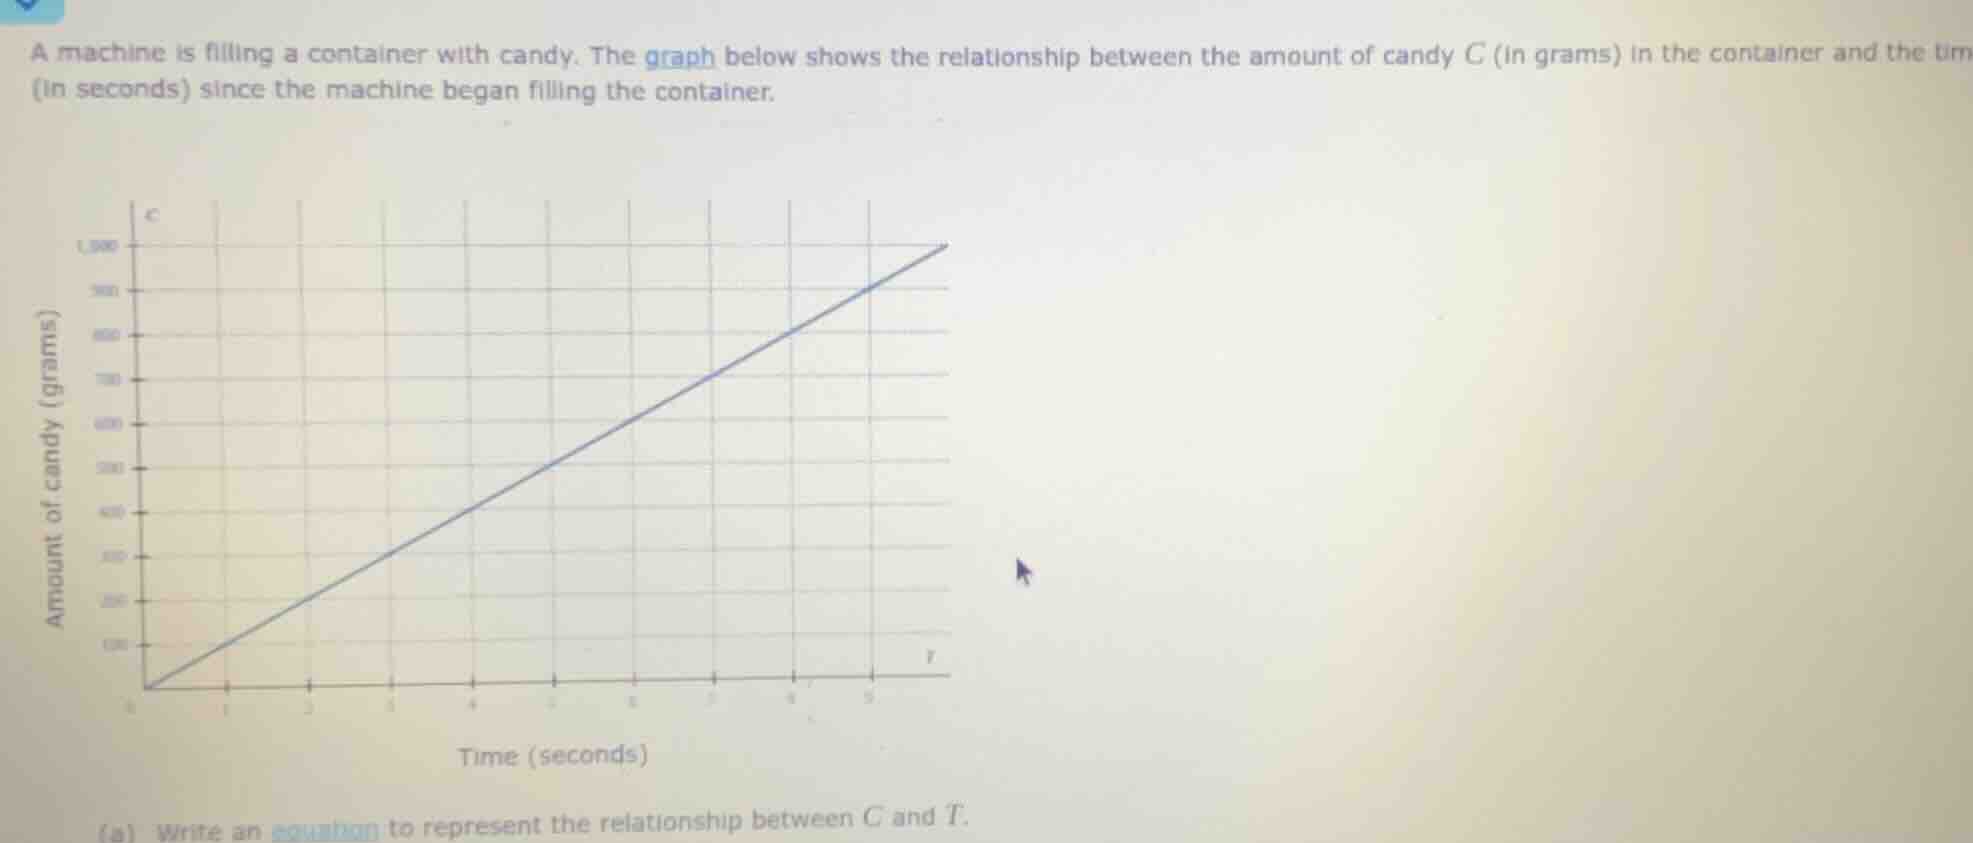
a machine is filling a container with candy. the graph below shows the relationship between the amount of candy c (in grams) in the container and the tim (in seconds) since the machine began filling the container.
(a) write an equation to represent the relationship between c and t.
Step1: Identify slope formula
The relationship is linear, so use slope formula $m=\frac{C_2-C_1}{T_2-T_1}$. Pick points $(0,0)$ and $(10,1000)$.
Step2: Calculate the slope
$$\begin{align*}
m&=\frac{1000-0}{10-0}\\
&=100
\end{align*}$$
Step3: Find y-intercept
When $T=0$, $C=0$, so intercept $b=0$.
Step4: Write linear equation
Use $C=mT+b$, substitute $m=100$, $b=0$.
$C=100T$

Snap & solve any problem in the app
Get step-by-step solutions on Sovi AI
Photo-based solutions with guided steps
Explore more problems and detailed explanations
$C=100T$