QUESTION IMAGE
Question
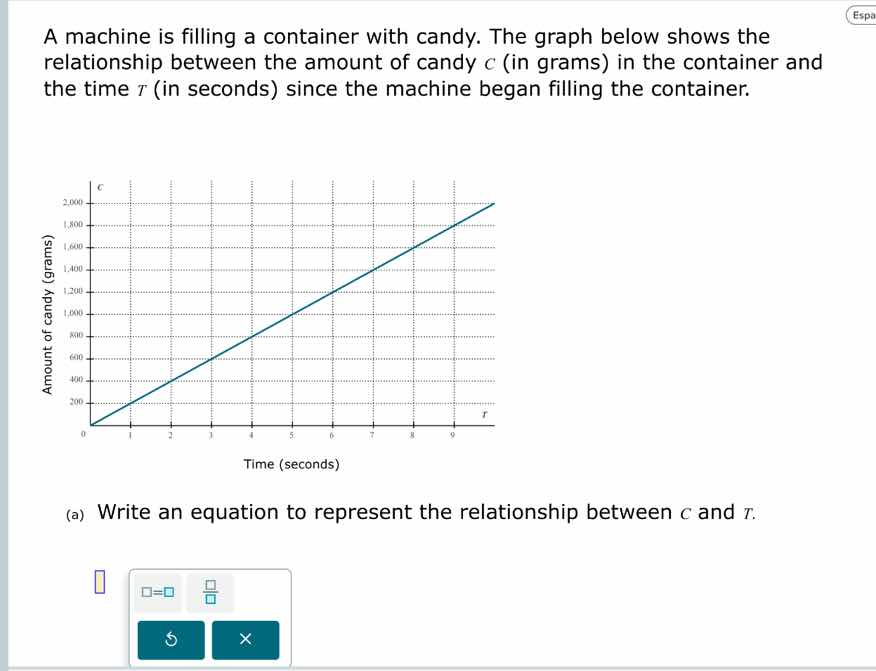
a machine is filling a container with candy. the graph below shows the relationship between the amount of candy $c$ (in grams) in the container and the time $t$ (in seconds) since the machine began filling the container.
(a) write an equation to represent the relationship between $c$ and $t$.
Step1: Identify slope (rate of change)
The graph passes through (0,0) and (10,2000). Slope $m = \frac{2000-0}{10-0} = 200$.
Step2: Write linear equation
Since the y-intercept is 0, use $c = mt$.
$c = 200t$

Snap & solve any problem in the app
Get step-by-step solutions on Sovi AI
Photo-based solutions with guided steps
Explore more problems and detailed explanations
$c = 200t$