QUESTION IMAGE
Question
machines
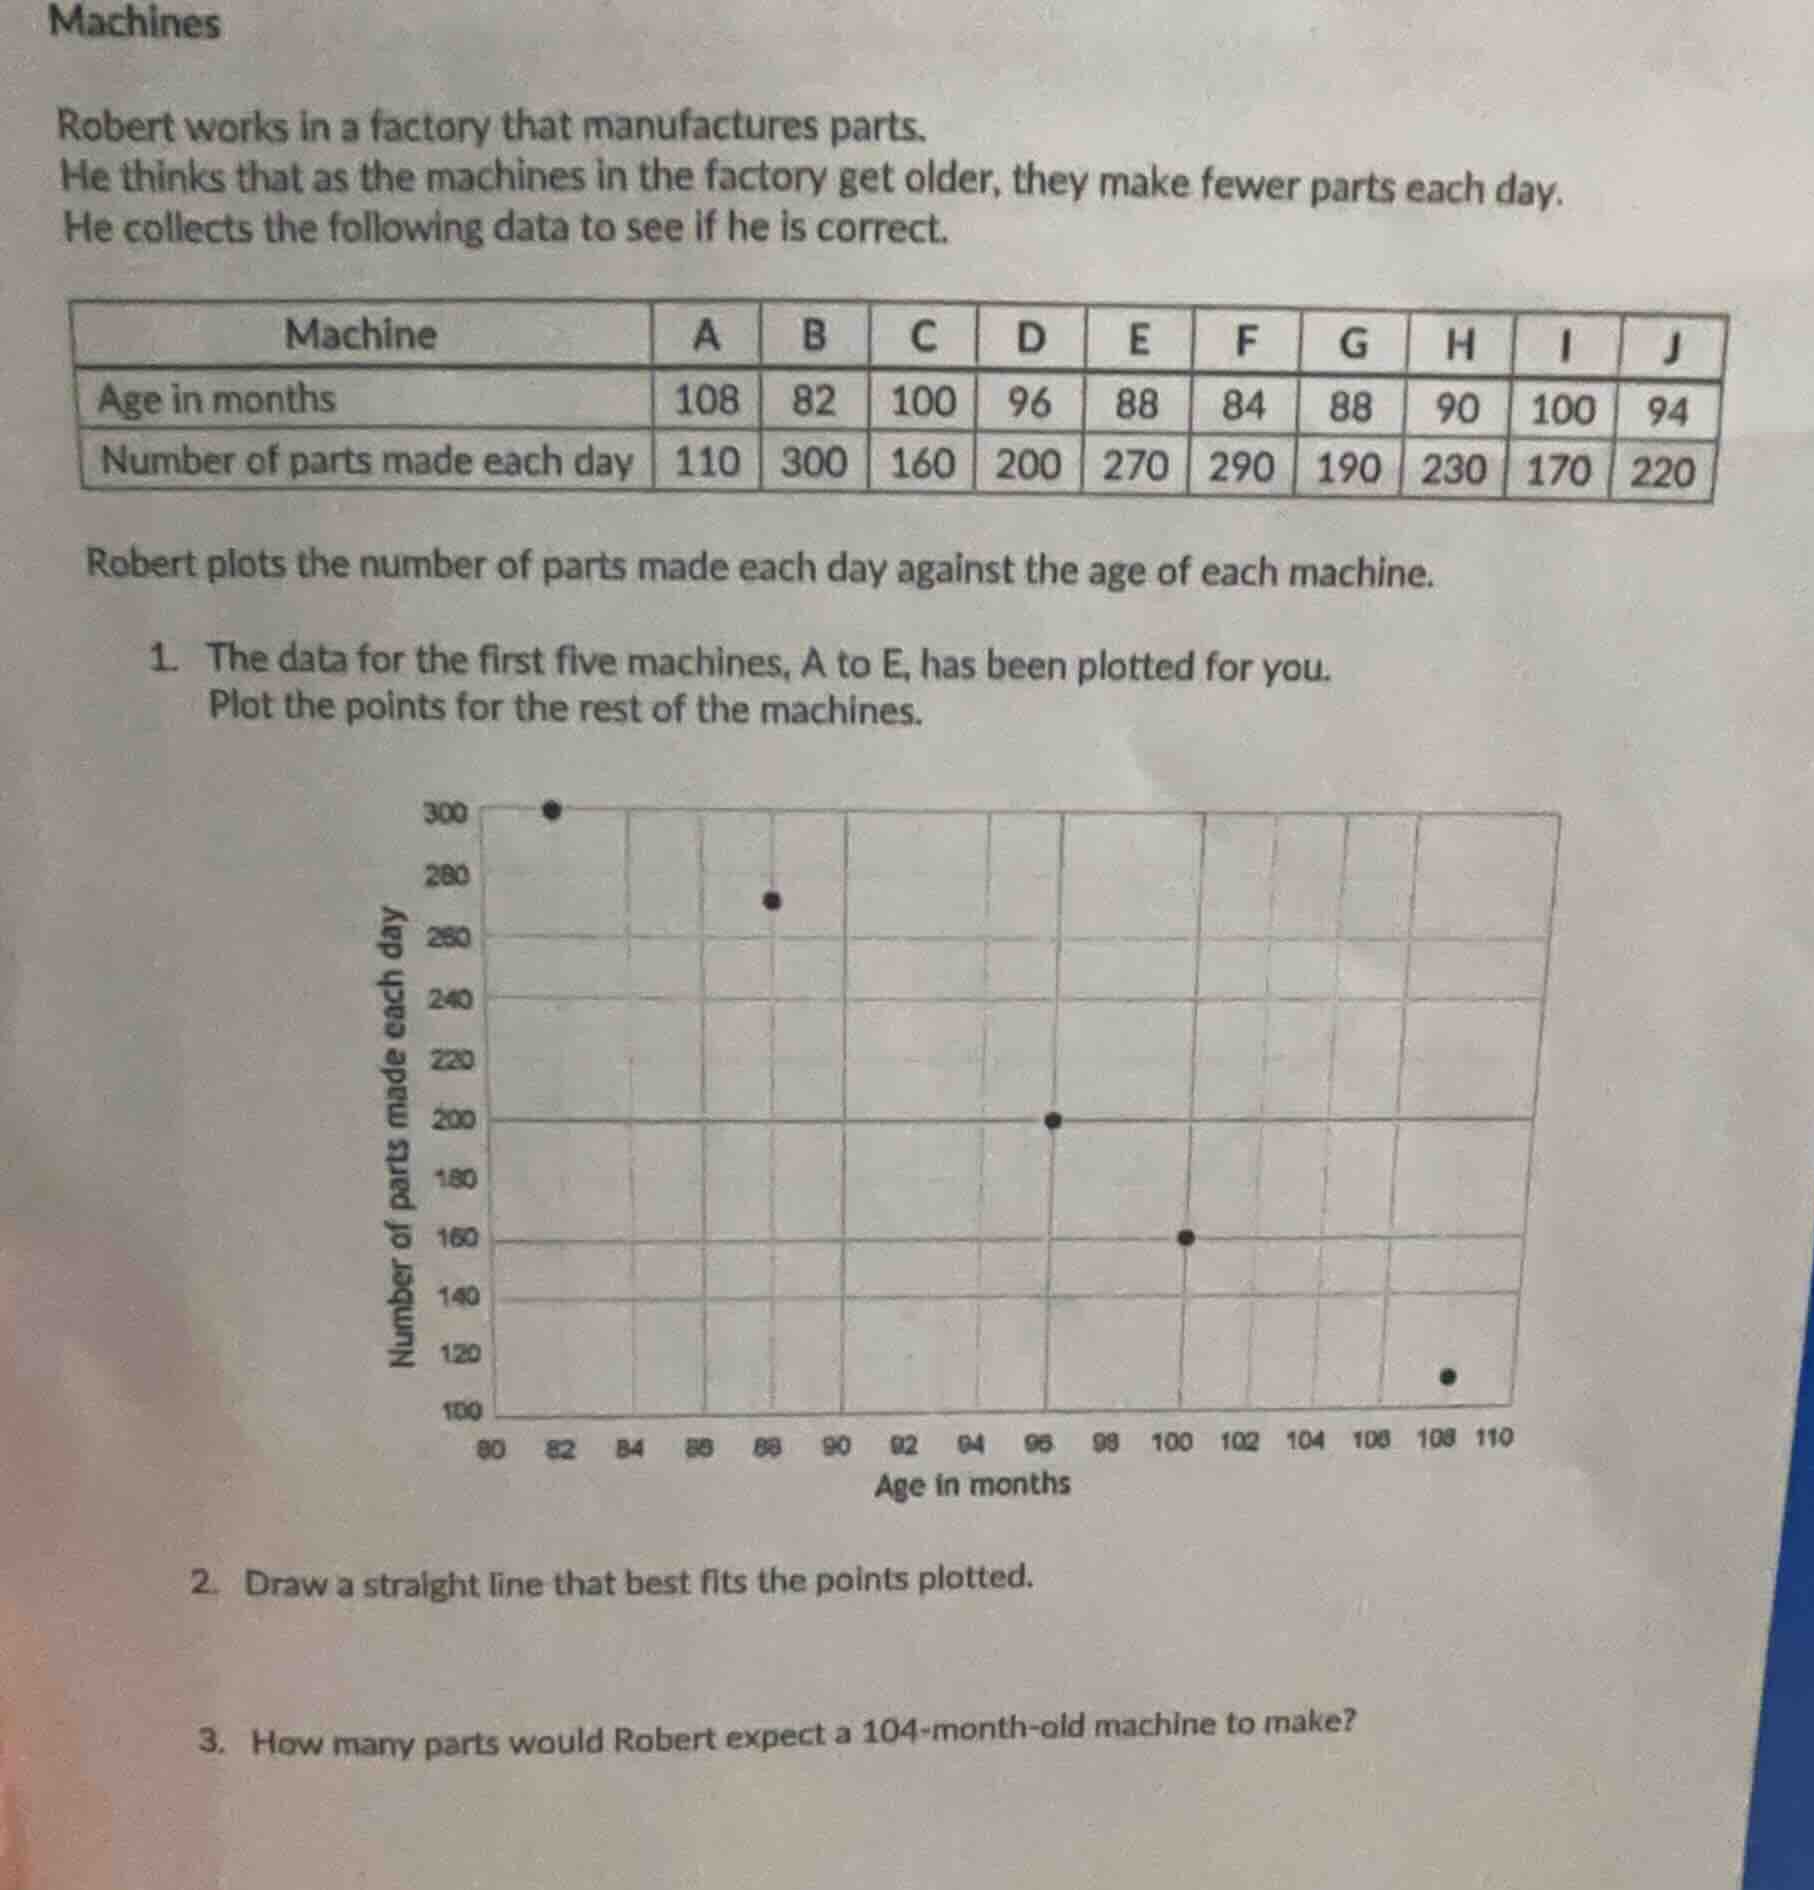
robert works in a factory that manufactures parts.
he thinks that as the machines in the factory get older, they make fewer parts each day.
he collects the following data to see if he is correct.
| machine | a | b | c | d | e | f | g | h | i | j |
|---|---|---|---|---|---|---|---|---|---|---|
| number of parts made each day | 110 | 300 | 160 | 200 | 270 | 290 | 190 | 230 | 170 | 220 |
robert plots the number of parts made each day against the age of each machine.
- the data for the first five machines, a to e, has been plotted for you.
plot the points for the rest of the machines.
scatter plot with number of parts made each day on y - axis and age in months on x - axis
- draw a straight line that best fits the points plotted.
- how many parts would robert expect a 104 - month - old machine to make?
Part 1: Plotting the Remaining Points
To plot the points for machines F - J, we use their age (x - axis) and number of parts (y - axis) from the table:
- Machine F: Age = 84 months, Parts = 290. Locate 84 on the x - axis and 290 on the y - axis, then plot the point.
- Machine G: Age = 88 months, Parts = 190. Locate 88 on the x - axis and 190 on the y - axis, then plot the point.
- Machine H: Age = 90 months, Parts = 230. Locate 90 on the x - axis and 230 on the y - axis, then plot the point.
- Machine I: Age = 100 months, Parts = 170. Locate 100 on the x - axis and 170 on the y - axis, then plot the point.
- Machine J: Age = 94 months, Parts = 220. Locate 94 on the x - axis and 220 on the y - axis, then plot the point.
Part 2: Drawing the Line of Best Fit
The line of best fit should pass through the middle of the plotted points, showing a negative trend (as age increases, parts made decrease). Visually, we align the line to minimize the distance from all points.
Part 3: Predicting Parts for a 104 - month - old Machine
- Understand the Trend: The scatter plot shows a negative linear relationship between machine age and parts made. The line of best fit can be used for prediction.
- Locate x = 104: On the x - axis (age in months), find 104.
- Find Corresponding y - value: Move up from x = 104 until intersecting the line of best fit, then left to the y - axis (number of parts). From the trend, we estimate the number of parts. By analyzing the slope of the line (approximate rate of decrease) and using the existing points, we can see that as age increases, parts decrease. For example, from age 100 (170 parts) to 108 (110 parts), the decrease is 60 parts over 8 months, so approximately 7.5 parts per month. At age 104 (4 months after 100), the decrease from 170 would be about 4×7.5 = 30. So 170 - 30 = 140. But a more accurate visual estimate from the line of best fit (after plotting all points) gives us around 140 - 150. A common estimate from the trend is 140 (or a value around this range, depending on the exact line drawn).
Final Answers (for Part 3)
Step1: Analyze the trend
The scatter plot shows a negative linear relationship between machine age and parts made.
Step2: Use the line of best fit
Locate 104 on the x - axis (age), then find the corresponding y - value (parts) on the line of best fit. By estimating the slope and using existing points, we predict the number of parts.

Snap & solve any problem in the app
Get step-by-step solutions on Sovi AI
Photo-based solutions with guided steps
Explore more problems and detailed explanations
Approximately 140 (the answer may vary slightly depending on the exact line of best fit drawn, but a reasonable estimate is around 140).