QUESTION IMAGE
Question
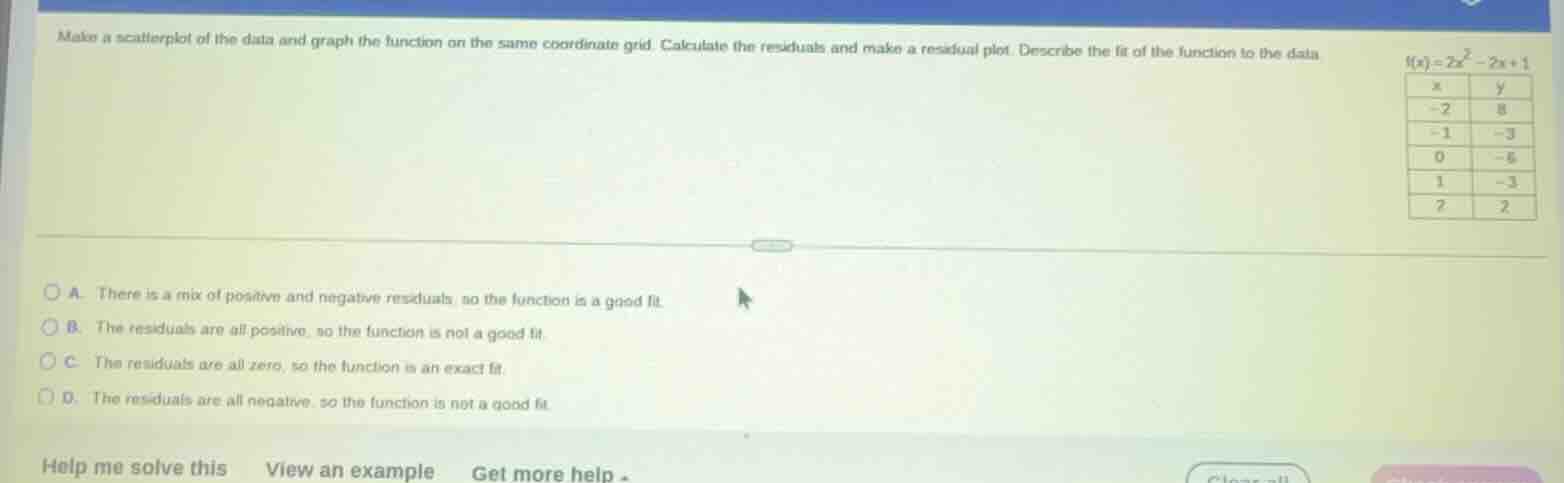
make a scatterplot of the data and graph the function on the same coordinate grid. calculate the residuals and make a residual plot. describe the fit of the function to the data $f(x)=2x^2 - 2x + 1$\
\
| $x$ | $y$ | \ |
| --- | --- | \ |
| -2 | 8 | \ |
| -1 | -3 | \ |
| 0 | -5 | \ |
| 1 | -3 | \ |
| 2 | 2 | \ |
\
\bigcirc a. there is a mix of positive and negative residuals, so the function is a good fit.\
\bigcirc b. the residuals are all positive, so the function is not a good fit.\
\bigcirc c. the residuals are all zero, so the function is an exact fit.\
\bigcirc d. the residuals are all negative, so the function is not a good fit.
Step1: Calculate predicted y-values
For each $x$, compute $f(x)=2x^2-2x+1$:
- $x=-2$: $2(-2)^2-2(-2)+1=8+4+1=13$
- $x=-1$: $2(-1)^2-2(-1)+1=2+2+1=5$
- $x=0$: $2(0)^2-2(0)+1=0+0+1=1$
- $x=1$: $2(1)^2-2(1)+1=2-2+1=1$
- $x=2$: $2(2)^2-2(2)+1=8-4+1=5$
Step2: Compute residuals (actual-predicted)
Residual = $y_{\text{actual}} - y_{\text{predicted}}$:
- $x=-2$: $13-13=0$
- $x=-1$: $5-5=0$
- $x=0$: $1-1=0$
- $x=1$: $1-1=0$
- $x=2$: $5-5=0$
Step3: Evaluate function fit
All residuals equal 0, so the function exactly matches the data.

Snap & solve any problem in the app
Get step-by-step solutions on Sovi AI
Photo-based solutions with guided steps
Explore more problems and detailed explanations
C. The residuals are all zero, so the function is an exact fit.