QUESTION IMAGE
Question
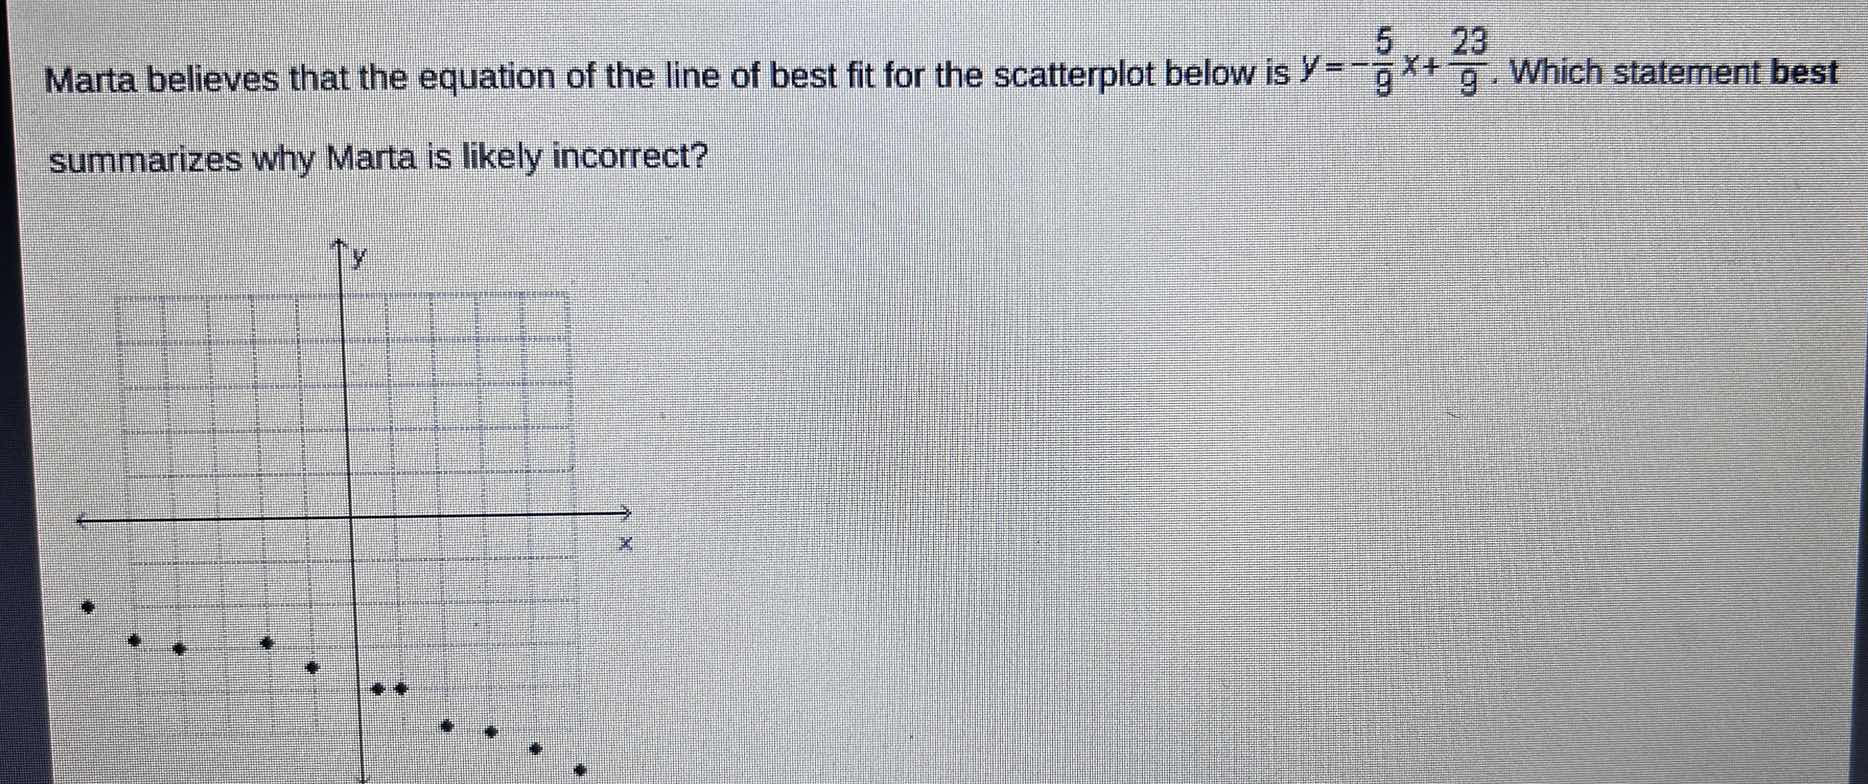
marta believes that the equation of the line of best fit for the scatterplot below is $y = -\frac{5}{9}x + \frac{23}{9}$. which statement best summarizes why marta is likely incorrect?
To determine why Marta is likely incorrect, we analyze the scatterplot and the line of best fit equation \( y = -\frac{5}{9}x + \frac{23}{9} \):
Step 1: Analyze the Trend of the Scatterplot
The scatterplot shows a negative correlation (as \( x \) increases, \( y \) decreases), so the slope sign (negative) of Marta’s equation is correct. However, we must check the intercept and the overall fit.
Step 2: Analyze the Intercept of Marta’s Equation
The \( y \)-intercept of \( y = -\frac{5}{9}x + \frac{23}{9} \) is \( \frac{23}{9} \approx 2.56 \), meaning the line would cross the \( y \)-axis above the origin. But the scatterplot’s points are clustered below the \( x \)-axis (or near the bottom of the grid), so the line of best fit should have a \( y \)-intercept that is negative (or much lower) to align with the data’s vertical position.
Step 3: Analyze the Slope Magnitude (Optional, but Contextual)
The slope \( -\frac{5}{9} \approx -0.56 \) is relatively shallow. Visually, the scatterplot’s points appear to have a steeper negative slope (i.e., \( y \) decreases more rapidly as \( x \) increases), but the most critical issue is the intercept—the line’s \( y \)-intercept is inconsistent with the data’s vertical location.
Key Reason for Incorrectness
Marta’s line of best fit has a positive \( y \)-intercept (≈ 2.56), but the scatterplot’s data lies predominantly below the \( x \)-axis (or at very low \( y \)-values). A line of best fit for this data should have a negative \( y \)-intercept (or a much lower intercept) to align with the cluster of points. Thus, the \( y \)-intercept of her equation does not match the data’s vertical position.
Marta’s equation \( y = -\frac{5}{9}x + \frac{23}{9} \) has a positive \( y \)-intercept (\( \frac{23}{9} \approx 2.56 \)), but the scatterplot’s data lies predominantly below the \( x \)-axis (or at low \( y \)-values). A line of best fit for this data should have a negative (or much lower) \( y \)-intercept to match the data’s vertical position. The positive intercept makes the line inconsistent with the data’s location.

Snap & solve any problem in the app
Get step-by-step solutions on Sovi AI
Photo-based solutions with guided steps
Explore more problems and detailed explanations
Marta’s line of best fit has a positive \( y \)-intercept (\( \frac{23}{9} \approx 2.56 \)), but the scatterplot’s data lies predominantly below the \( x \)-axis (or at low \( y \)-values). A line of best fit for this data should have a negative (or much lower) \( y \)-intercept to align with the data’s vertical position.