QUESTION IMAGE
Question
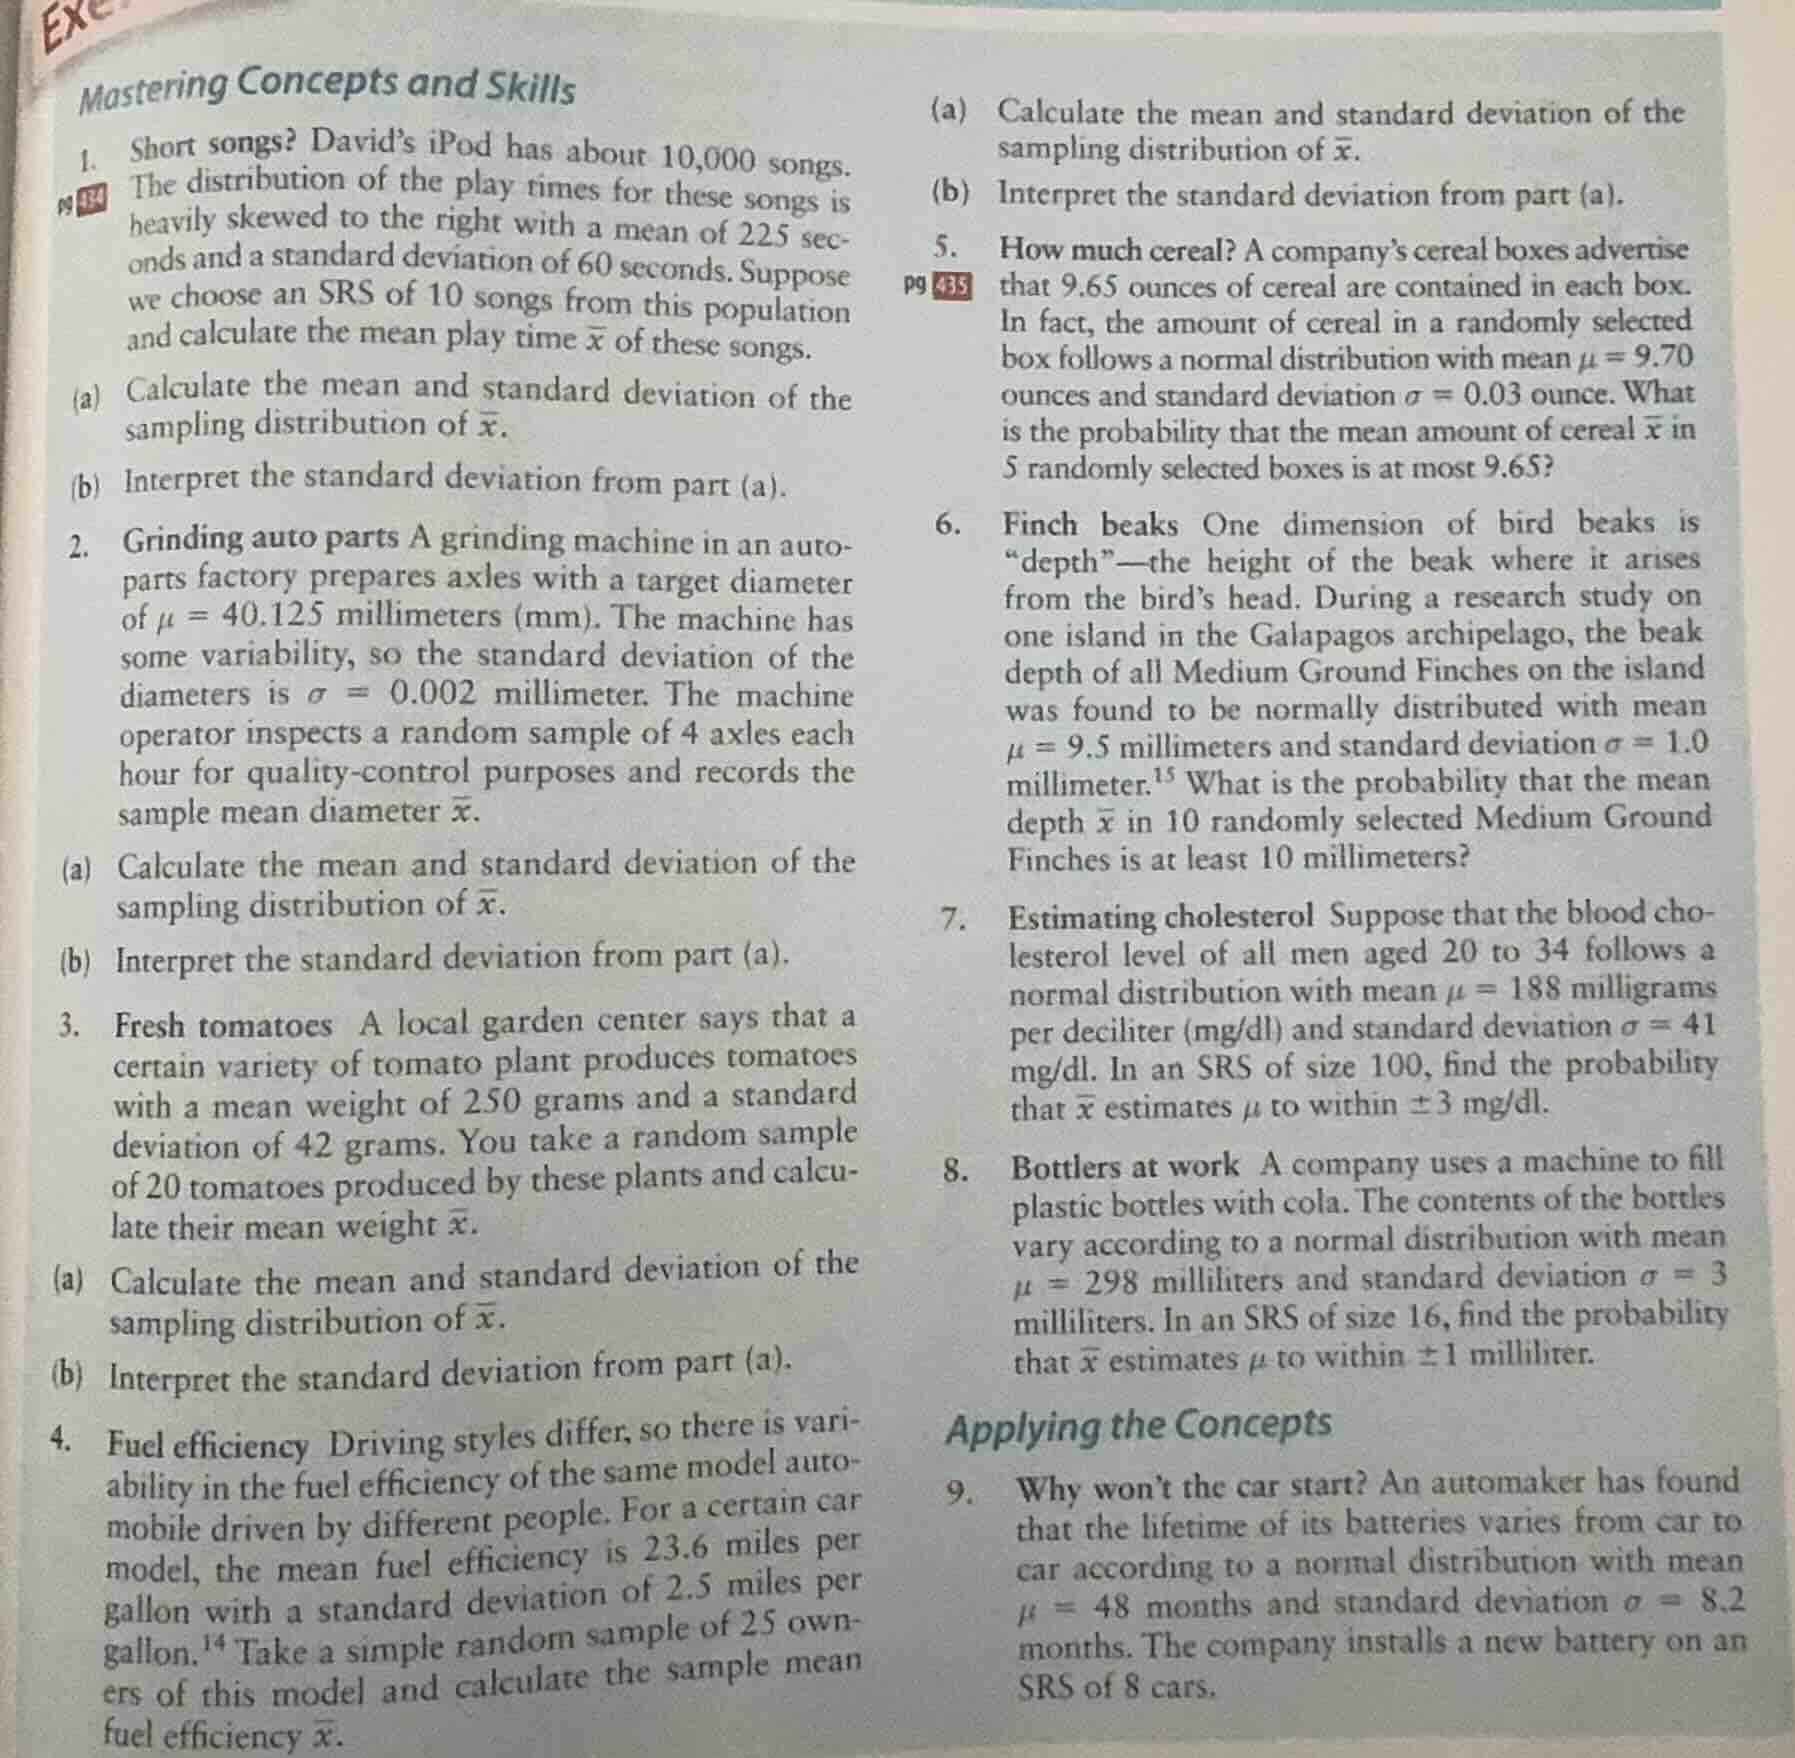
mastering concepts and skills
- short songs? david’s ipod has about 10,000 songs. the distribution of the play times for these songs is heavily skewed to the right with a mean of 225 seconds and a standard deviation of 60 seconds. suppose we choose an srs of 10 songs from this population and calculate the mean play time \\(\bar{x}\\) of these songs.
(a) calculate the mean and standard deviation of the sampling distribution of \\(\bar{x}\\).
(b) interpret the standard deviation from part (a).
- grinding auto parts a grinding machine in an auto - parts factory prepares axles with a target diameter of \\(\mu = 40.125\\) millimeters (mm). the machine has some variability, so the standard deviation of the diameters is \\(\sigma = 0.002\\) millimeter. the machine operator inspects a random sample of 4 axles each hour for quality - control purposes and records the sample mean diameter \\(\bar{x}\\).
(a) calculate the mean and standard deviation of the sampling distribution of \\(\bar{x}\\).
(b) interpret the standard deviation from part (a).
- fresh tomatoes a local garden center says that a certain variety of tomato plant produces tomatoes with a mean weight of 250 grams and a standard deviation of 42 grams. you take a random sample of 20 tomatoes produced by these plants and calculate their mean weight \\(\bar{x}\\).
(a) calculate the mean and standard deviation of the sampling distribution of \\(\bar{x}\\).
(b) interpret the standard deviation from part (a).
- fuel efficiency driving styles differ, so there is variability in the fuel efficiency of the same model automobile driven by different people. for a certain car model, the mean fuel efficiency is 23.6 miles per gallon with a standard deviation of 2.5 miles per gallon. take a simple random sample of 25 owners of this model and calculate the sample mean fuel efficiency \\(\bar{x}\\).
(a) calculate the mean and standard deviation of the sampling distribution of \\(\bar{x}\\).
(b) interpret the standard deviation from part (a).
- how much cereal? a company’s cereal boxes advertise that 9.65 ounces of cereal are contained in each box. in fact, the amount of cereal in a randomly selected box follows a normal distribution with mean \\(\mu = 9.70\\) ounces and standard deviation \\(\sigma = 0.03\\) ounce. what is the probability that the mean amount of cereal \\(\bar{x}\\) in 5 randomly selected boxes is at most 9.65?
- finch beaks one dimension of bird beaks is “depth”—the height of the beak where it arises from the bird’s head. during a research study on one island in the galapagos archipelago, the beak depth of all medium ground finches on the island was found to be normally distributed with mean \\(\mu = 9.5\\) millimeters and standard deviation \\(\sigma = 1.0\\) millimeter. what is the probability that the mean depth \\(\bar{x}\\) in 10 randomly selected medium ground finches is at least 10 millimeters?
- estimating cholesterol suppose that the blood cholesterol level of all men aged 20 to 34 follows a normal distribution with mean \\(\mu = 188\\) milligrams per deciliter (mg/dl) and standard deviation \\(\sigma = 41\\) mg/dl. in an srs of size 100, find the probability that \\(\bar{x}\\) estimates \\(\mu\\) to within \\(\pm 3\\) mg/dl.
- bottlers at work a company uses a machine to fill plastic bottles with cola. the contents of the bottles vary according to a normal distribution with mean \\(\mu = 298\\) milliliters and standard deviation \\(\sigma = 3\\) milliliters. in an srs of size 16, find the probability that \\(\bar{x}\\) estimates \\(\mu\\) to within \\(\pm 1\\) milliliter.
applying the concepts
- why won’t the car start? an automaker has found that the lifetime of its batteries varies from car to car according to a normal distribution with mean \\(\mu = 48\\) months and standard deviation \\(\sigma = 8.2\\) months. the company installs a new battery on an srs of 8 cars.
Let's solve problem 1(a) first:
Problem 1(a)
We have a population of song play times with mean $\mu = 225$ seconds and standard deviation $\sigma = 60$ seconds. We take an SRS (Simple Random Sample) of size $n = 10$.
Step 1: Mean of the sampling distribution of $\bar{x}$
The mean of the sampling distribution of the sample mean $\bar{x}$ (also called the expected value of $\bar{x}$) is equal to the population mean $\mu$. So,
$$\mu_{\bar{x}} = \mu = 225$$
Step 2: Standard deviation of the sampling distribution of $\bar{x}$ (standard error)
The standard deviation of the sampling distribution of $\bar{x}$ is given by $\frac{\sigma}{\sqrt{n}}$, where $\sigma$ is the population standard deviation and $n$ is the sample size. Here, $\sigma = 60$ and $n = 10$. So,
$$\sigma_{\bar{x}} = \frac{\sigma}{\sqrt{n}} = \frac{60}{\sqrt{10}} \approx \frac{60}{3.1623} \approx 18.97$$
Problem 1(b)
The standard deviation of the sampling distribution of $\bar{x}$ (approximately 18.97 seconds) tells us how much the sample mean play times $\bar{x}$ vary from sample to sample. If we were to take many different simple random samples of 10 songs from the population of songs, the sample mean play times would typically differ from the population mean (225 seconds) by about 18.97 seconds, on average.
Problem 2(a)
We have a population of axle diameters with mean $\mu = 40.125$ mm and standard deviation $\sigma = 0.002$ mm. We take a sample of size $n = 4$.
Step 1: Mean of the sampling distribution of $\bar{x}$
$$\mu_{\bar{x}} = \mu = 40.125$$
Step 2: Standard deviation of the sampling distribution of $\bar{x}$
$$\sigma_{\bar{x}} = \frac{\sigma}{\sqrt{n}} = \frac{0.002}{\sqrt{4}} = \frac{0.002}{2} = 0.001$$
Problem 2(b)
The standard deviation of the sampling distribution of $\bar{x}$ (0.001 mm) tells us the typical amount by which the sample mean axle diameters $\bar{x}$ differ from the population mean (40.125 mm) when we take many different simple random samples of 4 axles. In other words, if we repeatedly sample 4 axles and calculate the sample mean diameter, these sample means will vary from the true population mean by about 0.001 mm, on average.
Problem 3(a)
We have a population of tomato weights with mean $\mu = 250$ grams and standard deviation $\sigma = 42$ grams. We take a sample of size $n = 20$.
Step 1: Mean of the sampling distribution of $\bar{x}$
$$\mu_{\bar{x}} = \mu = 250$$
Step 2: Standard deviation of the sampling distribution of $\bar{x}$
$$\sigma_{\bar{x}} = \frac{\sigma}{\sqrt{n}} = \frac{42}{\sqrt{20}} \approx \frac{42}{4.4721} \approx 9.39$$
Problem 3(b)
The standard deviation of the sampling distribution of $\bar{x}$ (approximately 9.39 grams) represents the typical variation in the sample mean weights $\bar{x}$ from one sample of 20 tomatoes to another. If we take many different simple random samples of 20 tomatoes, the sample mean weights will differ from the population mean (250 grams) by about 9.39 grams, on average.
Problem 4(a)
We have a population of fuel efficiencies with mean $\mu = 23.6$ miles per gallon and standard deviation $\sigma = 2.5$ miles per gallon. We take a sample of size $n = 25$.
Step 1: Mean of the sampling distribution of $\bar{x}$
$$\mu_{\bar{x}} = \mu = 23.6$$
Step 2: Standard deviation of the sampling distribution of $\bar{x}$
$$\sigma_{\bar{x}} = \frac{\sigma}{\sqrt{n}} = \frac{2.5}{\sqrt{25}} = \frac{2.5}{5} = 0.5$$
Problem 4(b)
The standard deviation of the sampling distribution of $\bar{x}$ (0.5 miles per gallon) indicates th…

Snap & solve any problem in the app
Get step-by-step solutions on Sovi AI
Photo-based solutions with guided steps
Explore more problems and detailed explanations
Let's solve problem 1(a) first:
Problem 1(a)
We have a population of song play times with mean $\mu = 225$ seconds and standard deviation $\sigma = 60$ seconds. We take an SRS (Simple Random Sample) of size $n = 10$.
Step 1: Mean of the sampling distribution of $\bar{x}$
The mean of the sampling distribution of the sample mean $\bar{x}$ (also called the expected value of $\bar{x}$) is equal to the population mean $\mu$. So,
$$\mu_{\bar{x}} = \mu = 225$$
Step 2: Standard deviation of the sampling distribution of $\bar{x}$ (standard error)
The standard deviation of the sampling distribution of $\bar{x}$ is given by $\frac{\sigma}{\sqrt{n}}$, where $\sigma$ is the population standard deviation and $n$ is the sample size. Here, $\sigma = 60$ and $n = 10$. So,
$$\sigma_{\bar{x}} = \frac{\sigma}{\sqrt{n}} = \frac{60}{\sqrt{10}} \approx \frac{60}{3.1623} \approx 18.97$$
Problem 1(b)
The standard deviation of the sampling distribution of $\bar{x}$ (approximately 18.97 seconds) tells us how much the sample mean play times $\bar{x}$ vary from sample to sample. If we were to take many different simple random samples of 10 songs from the population of songs, the sample mean play times would typically differ from the population mean (225 seconds) by about 18.97 seconds, on average.
Problem 2(a)
We have a population of axle diameters with mean $\mu = 40.125$ mm and standard deviation $\sigma = 0.002$ mm. We take a sample of size $n = 4$.
Step 1: Mean of the sampling distribution of $\bar{x}$
$$\mu_{\bar{x}} = \mu = 40.125$$
Step 2: Standard deviation of the sampling distribution of $\bar{x}$
$$\sigma_{\bar{x}} = \frac{\sigma}{\sqrt{n}} = \frac{0.002}{\sqrt{4}} = \frac{0.002}{2} = 0.001$$
Problem 2(b)
The standard deviation of the sampling distribution of $\bar{x}$ (0.001 mm) tells us the typical amount by which the sample mean axle diameters $\bar{x}$ differ from the population mean (40.125 mm) when we take many different simple random samples of 4 axles. In other words, if we repeatedly sample 4 axles and calculate the sample mean diameter, these sample means will vary from the true population mean by about 0.001 mm, on average.
Problem 3(a)
We have a population of tomato weights with mean $\mu = 250$ grams and standard deviation $\sigma = 42$ grams. We take a sample of size $n = 20$.
Step 1: Mean of the sampling distribution of $\bar{x}$
$$\mu_{\bar{x}} = \mu = 250$$
Step 2: Standard deviation of the sampling distribution of $\bar{x}$
$$\sigma_{\bar{x}} = \frac{\sigma}{\sqrt{n}} = \frac{42}{\sqrt{20}} \approx \frac{42}{4.4721} \approx 9.39$$
Problem 3(b)
The standard deviation of the sampling distribution of $\bar{x}$ (approximately 9.39 grams) represents the typical variation in the sample mean weights $\bar{x}$ from one sample of 20 tomatoes to another. If we take many different simple random samples of 20 tomatoes, the sample mean weights will differ from the population mean (250 grams) by about 9.39 grams, on average.
Problem 4(a)
We have a population of fuel efficiencies with mean $\mu = 23.6$ miles per gallon and standard deviation $\sigma = 2.5$ miles per gallon. We take a sample of size $n = 25$.
Step 1: Mean of the sampling distribution of $\bar{x}$
$$\mu_{\bar{x}} = \mu = 23.6$$
Step 2: Standard deviation of the sampling distribution of $\bar{x}$
$$\sigma_{\bar{x}} = \frac{\sigma}{\sqrt{n}} = \frac{2.5}{\sqrt{25}} = \frac{2.5}{5} = 0.5$$
Problem 4(b)
The standard deviation of the sampling distribution of $\bar{x}$ (0.5 miles per gallon) indicates that if we take many different simple random samples of 25 car owners of this model and calculate the sample mean fuel efficiency, these sample means will typically differ from the population mean (23.6 miles per gallon) by about 0.5 miles per gallon, on average.
Problem 5
We have a population of cereal box amounts with mean $\mu = 9.70$ ounces and standard deviation $\sigma = 0.03$ ounce. We take a sample of size $n = 5$. We want to find $P(\bar{x} \leq 9.65)$.
Step 1: Mean and standard deviation of the sampling distribution of $\bar{x}$
- Mean: $\mu_{\bar{x}} = \mu = 9.70$
- Standard deviation: $\sigma_{\bar{x}} = \frac{\sigma}{\sqrt{n}} = \frac{0.03}{\sqrt{5}} \approx \frac{0.03}{2.2361} \approx 0.0134$
Step 2: Calculate the z-score
The z-score for $\bar{x} = 9.65$ is given by:
$$z = \frac{\bar{x} - \mu_{\bar{x}}}{\sigma_{\bar{x}}} = \frac{9.65 - 9.70}{0.0134} \approx \frac{-0.05}{0.0134} \approx -3.73$$
Step 3: Find the probability
We want $P(Z \leq -3.73)$. Looking at the standard normal table, the probability corresponding to $z = -3.73$ is very close to 0 (since $z = -3.73$ is far in the left tail of the standard normal distribution). Using a calculator or more precise table, $P(Z \leq -3.73) \approx 0.0001$ (or 0.01%).
Problem 6
We have a population of finch beak depths with mean $\mu = 9.5$ mm and standard deviation $\sigma = 1.0$ mm. We take a sample of size $n = 10$. We want to find $P(\bar{x} \geq 10)$.
Step 1: Mean and standard deviation of the sampling distribution of $\bar{x}$
- Mean: $\mu_{\bar{x}} = \mu = 9.5$
- Standard deviation: $\sigma_{\bar{x}} = \frac{\sigma}{\sqrt{n}} = \frac{1.0}{\sqrt{10}} \approx \frac{1.0}{3.1623} \approx 0.3162$
Step 2: Calculate the z-score
The z-score for $\bar{x} = 10$ is:
$$z = \frac{\bar{x} - \mu_{\bar{x}}}{\sigma_{\bar{x}}} = \frac{10 - 9.5}{0.3162} \approx \frac{0.5}{0.3162} \approx 1.58$$
Step 3: Find the probability
We want $P(Z \geq 1.58) = 1 - P(Z < 1.58)$. From the standard normal table, $P(Z < 1.58) \approx 0.9429$. So,
$$P(Z \geq 1.58) = 1 - 0.9429 = 0.0571$$ (or 5.71%).
Problem 7
We have a population of cholesterol levels with mean $\mu = 188$ mg/dl and standard deviation $\sigma = 41$ mg/dl. We take a sample of size $n = 100$. We want to find $P(188 - 3 \leq \bar{x} \leq 188 + 3) = P(185 \leq \bar{x} \leq 191)$.
Step 1: Mean and standard deviation of the sampling distribution of $\bar{x}$
- Mean: $\mu_{\bar{x}} = \mu = 188$
- Standard deviation: $\sigma_{\bar{x}} = \frac{\sigma}{\sqrt{n}} = \frac{41}{\sqrt{100}} = \frac{41}{10} = 4.1$
Step 2: Calculate the z-scores
For $\bar{x} = 185$:
$$z_1 = \frac{185 - 188}{4.1} = \frac{-3}{4.1} \approx -0.73$$
For $\bar{x} = 191$:
$$z_2 = \frac{191 - 188}{4.1} = \frac{3}{4.1} \approx 0.73$$
Step 3: Find the probability
We want $P(-0.73 \leq Z \leq 0.73) = P(Z \leq 0.73) - P(Z \leq -0.73)$. From the standard normal table:
- $P(Z \leq 0.73) \approx 0.7673$
- $P(Z \leq -0.73) \approx 0.2327$
So,
$$P(-0.73 \leq Z \leq 0.73) = 0.7673 - 0.2327 = 0.5346$$ (or 53.46%).
Problem 8
We have a population of cola bottle contents with mean $\mu = 298$ milliliters and standard deviation $\sigma = 3$ milliliters. We take a sample of size $n = 16$. We want to find $P(298 - 1 \leq \bar{x} \leq 298 + 1) = P(297 \leq \bar{x} \leq 299)$.
Step 1: Mean and standard deviation of the sampling distribution of $\bar{x}$
- Mean: $\mu_{\bar{x}} = \mu = 298$
- Standard deviation: $\sigma_{\bar{x}} = \frac{\sigma}{\sqrt{n}} = \frac{3}{\sqrt{16}} = \frac{3}{4} = 0.75$
Step 2: Calculate the z-scores
For $\bar{x} = 297$:
$$z_1 = \frac{297 - 298}{0.75} = \frac{-1}{0.75} \approx -1.33$$
For $\bar{x} = 299$:
$$z_2 = \frac{299 - 298}{0.75} = \frac{1}{0.75} \approx 1.33$$
Step 3: Find the probability
We want $P(-1.33 \leq Z \leq 1.33) = P(Z \leq 1.33) - P(Z \leq -1.33)$. From the standard normal table:
- $P(Z \leq 1.33) \approx 0.9082$
- $P(Z \leq -1.33) \approx 0.0918$
So,
$$P(-1.33 \leq Z \leq 1.33) = 0.9082 - 0.0918 = 0.8164$$ (or 81.64%).
Problem 9 (part not fully shown, but assuming similar sampling distribution questions)
If we assume we need to find the mean and standard deviation of the sampling distribution of the sample mean battery lifetimes:
- Population mean $\mu = 48$ months, population standard deviation $\sigma = 8.2$ months, sample size $n = 8$.
Mean of the sampling distribution of $\bar{x}$:
$$\mu_{\bar{x}} = \mu = 48$$
Standard deviation of the sampling distribution of $\bar{x}$:
$$\sigma_{\bar{x}} = \frac{\sigma}{\sqrt{n}} = \frac{8.2}{\sqrt{8}} \approx \frac{8.2}{2.8284} \approx 2.90$$
Final Answers (Summarized)
Problem 1(a)
- Mean of $\bar{x}$: $\boldsymbol{225}$ seconds
- Standard deviation of $\bar{x}$: $\boldsymbol{\approx 18.97}$ seconds
Problem 1(b)
The sample mean play times vary by about 18.97 seconds from the population mean, on average, across different samples of 10 songs.
Problem 2(a)
- Mean of $\bar{x}$: $\boldsymbol{40.125}$ mm
- Standard deviation of $\bar{x}$: $\boldsymbol{0.001}$ mm
Problem 2(b)
The sample mean axle diameters vary by about 0.001 mm from the population mean, on average, across different samples of 4 axles.
Problem 3(a)
- Mean of $\bar{x}$: $\boldsymbol{250}$ grams
- Standard deviation of $\bar{x}$: $\boldsymbol{\approx 9.39}$ grams
Problem 3(b)
The sample mean tomato weights vary by about 9.39 grams from the population mean, on average, across different samples of 20 tomatoes.
Problem 4(a)
- Mean of $\bar{x}$: $\boldsymbol{23.6}$ miles per gallon
- Standard deviation of $\bar{x}$: $\boldsymbol{0.5}$ miles per gallon
Problem 4(b)
The sample mean fuel efficiencies vary by about 0.5 miles per gallon from the population mean, on average, across different samples of 25 cars.
Problem 5
Probability that $\bar{x} \leq 9.65$: $\boldsymbol{\approx 0.0001}$ (or 0.01%)
Problem 6
Probability that $\bar{x} \geq 10$: $\boldsymbol{\approx 0.0571}$ (or 5.71%)
Problem 7
Probability that $\bar{x}$ is within $\pm 3$ mg/dl of $\mu$: $\boldsymbol{\approx 0.5346}$ (or 53.46%)
Problem 8
Probability that $\bar{x}$ is within $\pm 1$ milliliter of $\mu$: $\boldsymbol{\approx 0.8164}$ (or 81.64%)
Problem 9 (Assumed Part)
- Mean of $\bar{x}$: $\boldsymbol{48}$ months
- Standard deviation of $\bar{x}$: $\boldsymbol{\approx 2.90}$ months