QUESTION IMAGE
Question
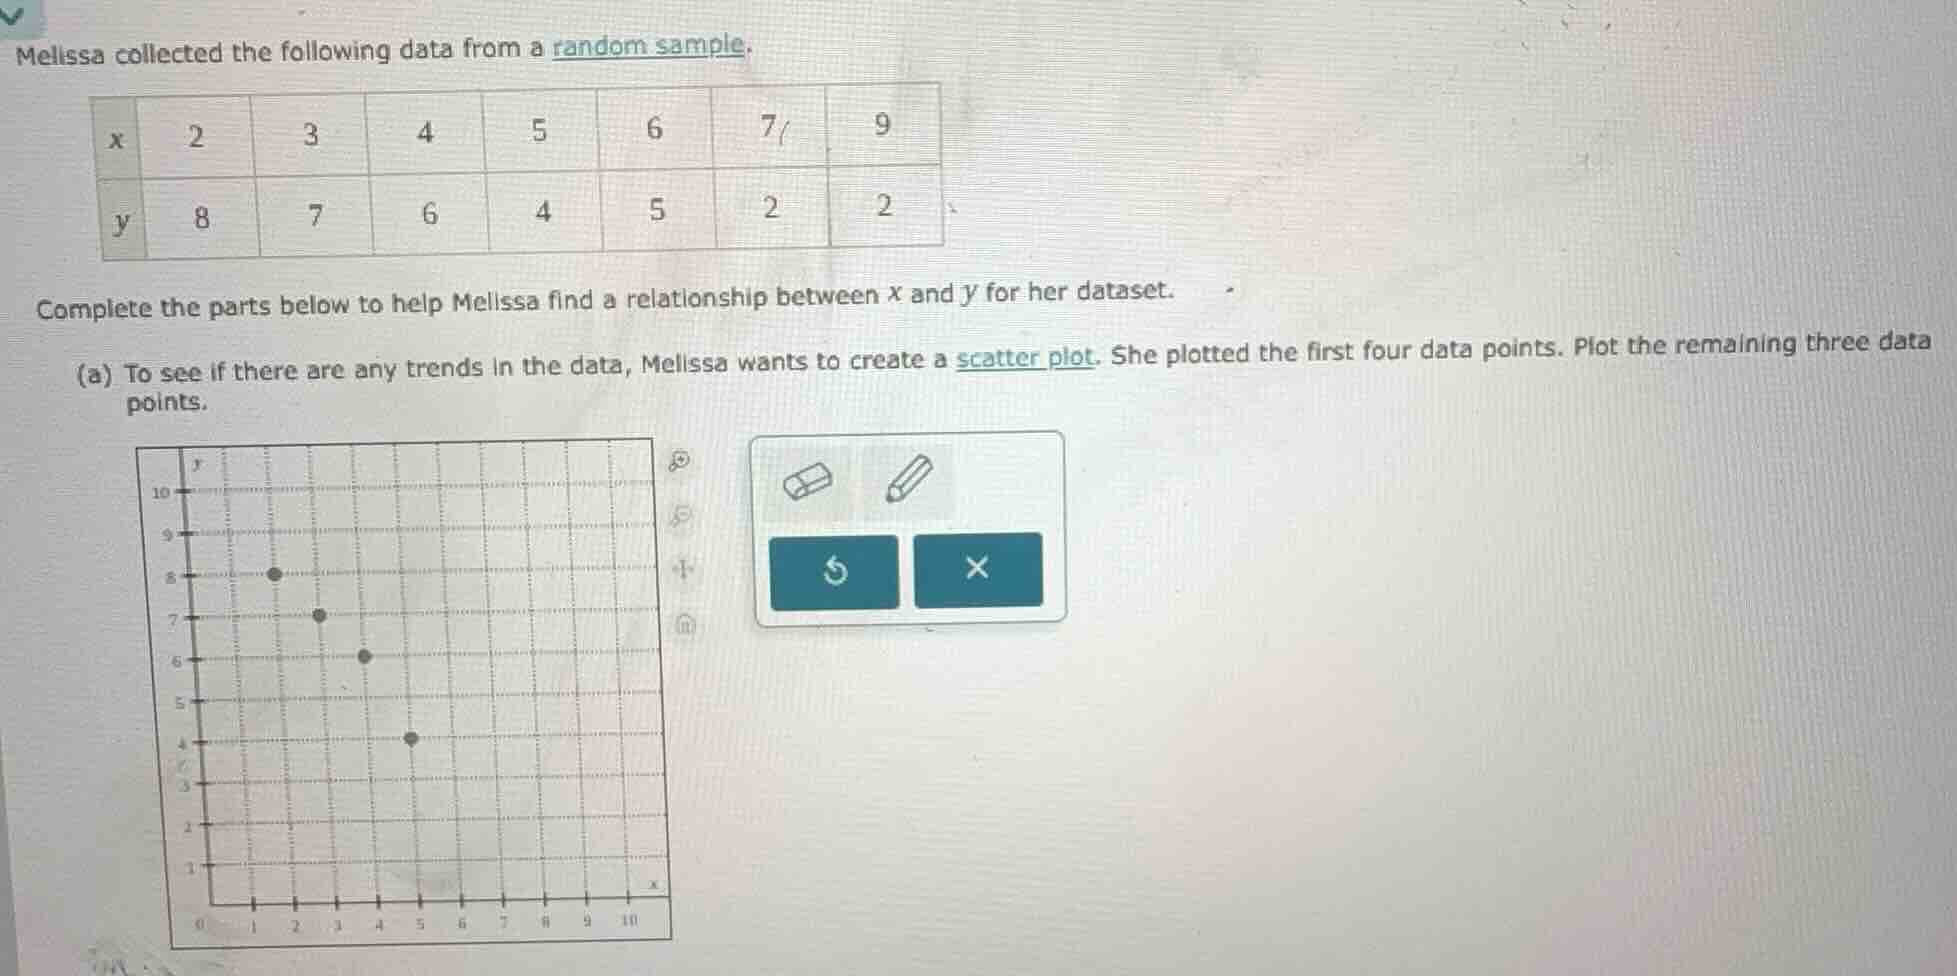
melissa collected the following data from a random sample.
| x | 2 | 3 | 4 | 5 | 6 | 7 | 9 |
| y | 8 | 7 | 6 | 4 | 5 | 2 | 2 |
complete the parts below to help melissa find a relationship between x and y for her dataset.
(a) to see if there are any trends in the data, melissa wants to create a scatter plot. she plotted the first four data points. plot the remaining three data points.
Step1: Identify remaining data points
The remaining points are $(6,5)$, $(7,2)$, $(9,2)$
Step2: Plot points on scatter plot
- For $(6,5)$: Locate $x=6$ on horizontal axis, move up to $y=5$ and mark the point.
- For $(7,2)$: Locate $x=7$ on horizontal axis, move up to $y=2$ and mark the point.
- For $(9,2)$: Locate $x=9$ on horizontal axis, move up to $y=2$ and mark the point.

Snap & solve any problem in the app
Get step-by-step solutions on Sovi AI
Photo-based solutions with guided steps
Explore more problems and detailed explanations
The remaining three points plotted on the scatter plot are:
- Point at $(6, 5)$
- Point at $(7, 2)$
- Point at $(9, 2)$