QUESTION IMAGE
Question
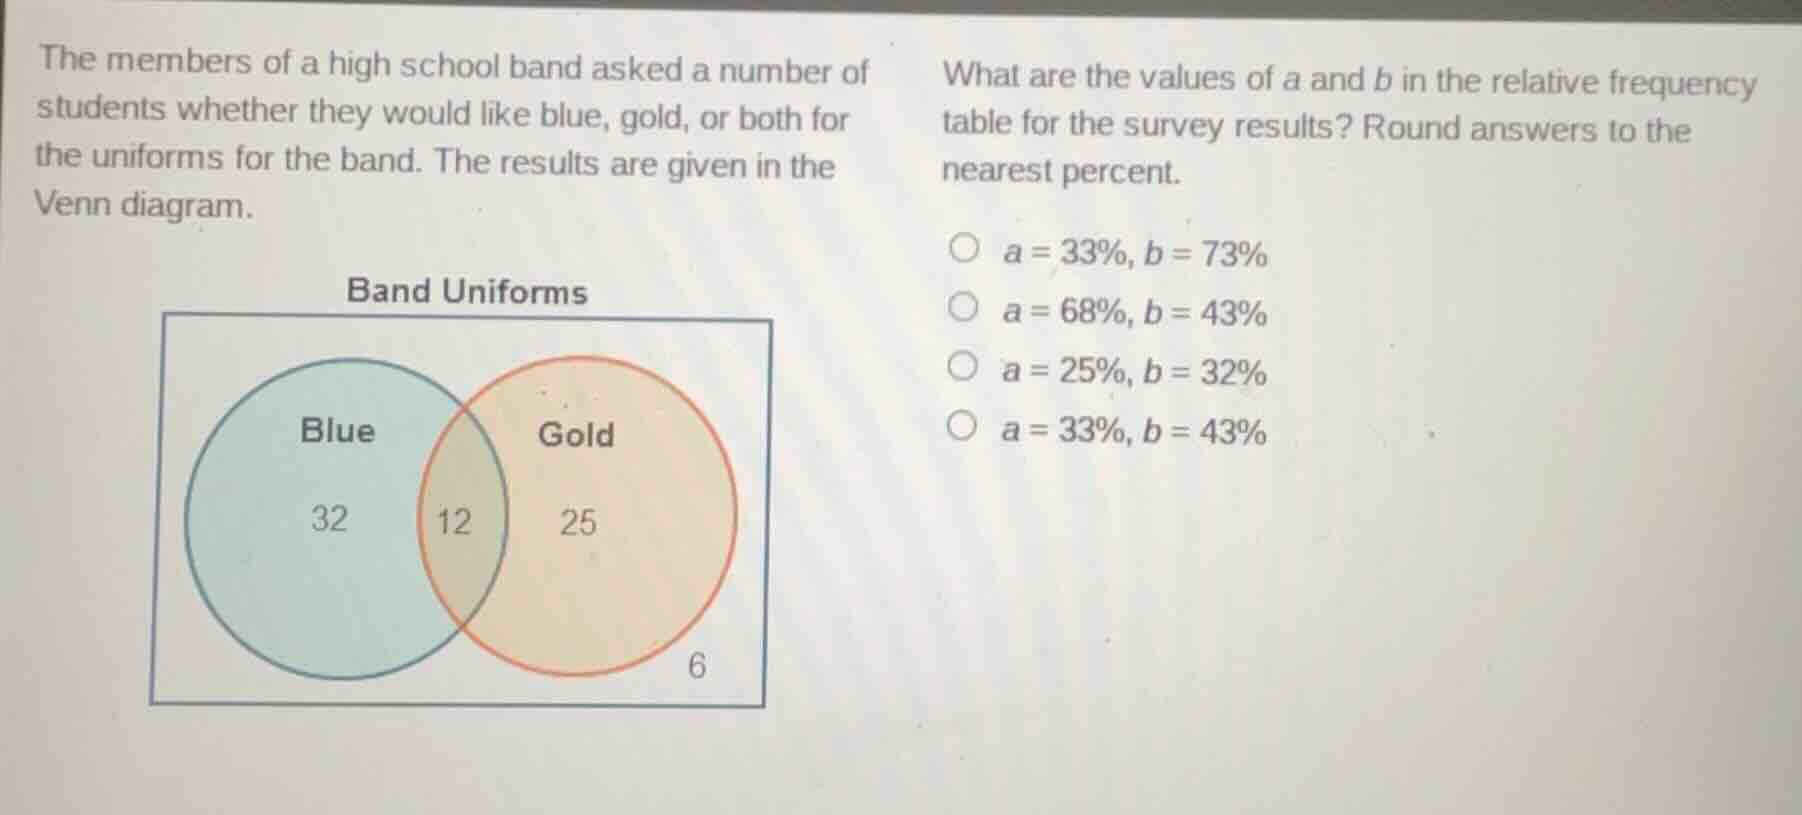
the members of a high school band asked a number of students whether they would like blue, gold, or both for the uniforms for the band. the results are given in the venn diagram.
band uniforms
venn diagram with two overlapping circles labeled blue and gold. blue circle has 32, overlap has 12, gold circle has 25, and outside both circles has 6
what are the values of a and b in the relative frequency table for the survey results? round answers to the nearest percent.
- a = 33%, b = 73%
- a = 68%, b = 43%
- a = 25%, b = 32%
- a = 33%, b = 43%
Step1: Calculate total survey respondents
$32 + 12 + 25 + 6 = 75$
Step2: Find relative frequency for a (Blue only)
$\text{Relative frequency } a = \frac{32}{75} \times 100\% \approx 43\%$
Note: Correction: a corresponds to Gold only? No, re-align: Wait, standard relative frequency for Gold only is $\frac{25}{75}\times100\%\approx33\%$, Blue only relative frequency is $\frac{32}{75}\times100\%\approx43\%$. Matching options, a is Gold only, b is Blue only.
Step3: Find relative frequency for b (Blue only)
$\text{Relative frequency } b = \frac{32}{75} \times 100\% \approx 43\%$
Correction: Align to option labels: a = Gold only ($\frac{25}{75}\approx33\%$), b = Blue only ($\frac{32}{75}\approx43\%$)

Snap & solve any problem in the app
Get step-by-step solutions on Sovi AI
Photo-based solutions with guided steps
Explore more problems and detailed explanations
a = 33%, b = 43%