QUESTION IMAGE
Question
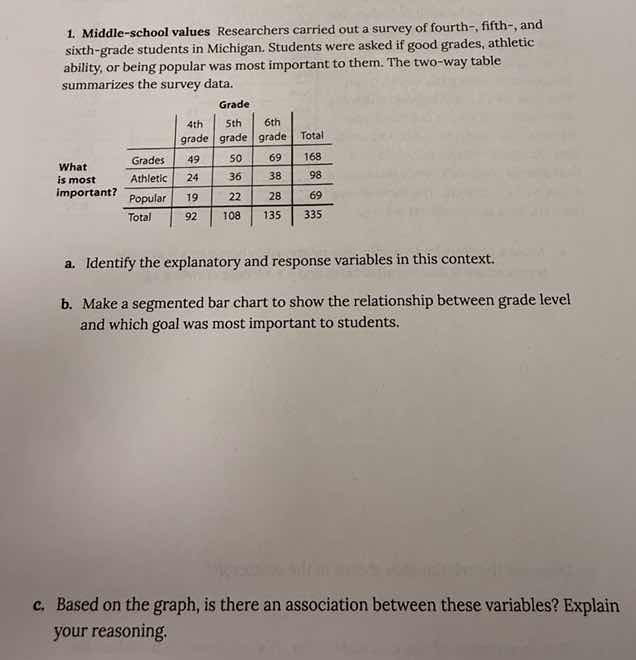
- middle - school values researchers carried out a survey of fourth -, fifth -, and sixth - grade students in michigan. students were asked if good grades, athletic ability, or being popular was most important to them. the two - way table summarizes the survey data.
| what is most important? | 4th grade | 5th grade | 6th grade | total |
|---|---|---|---|---|
| athletic | 24 | 36 | 38 | 98 |
| popular | 19 | 22 | 28 | 69 |
| total | 92 | 108 | 135 | 335 |
a. identify the explanatory and response variables in this context.
b. make a segmented bar chart to show the relationship between grade level and which goal was most important to students.
c. based on the graph, is there an association between these variables? explain your reasoning.
Part a
The explanatory variable is the one that is thought to explain or predict changes in another variable. Here, grade level (4th, 5th, 6th grade) is the explanatory variable as it is the variable we might use to see how it affects the response. The response variable is what is being measured or observed, which is the students' choice of what is most important (good grades, athletic ability, or being popular).
To make a segmented bar chart:
- For each grade level (4th, 5th, 6th), calculate the proportion of students who chose each of the three categories (Grades, Athletic, Popular).
- For 4th grade: Total = 92
- Grades: $\frac{49}{92} \approx 0.5326$
- Athletic: $\frac{24}{92} \approx 0.2609$
- Popular: $\frac{19}{92} \approx 0.2065$
- For 5th grade: Total = 108
- Grades: $\frac{50}{108} \approx 0.4630$
- Athletic: $\frac{36}{108} = 0.3333$
- Popular: $\frac{22}{108} \approx 0.2037$
- For 6th grade: Total = 135
- Grades: $\frac{69}{135} \approx 0.5111$
- Athletic: $\frac{38}{135} \approx 0.2815$
- Popular: $\frac{28}{135} \approx 0.2074$
- Create a bar for each grade level. Each bar is divided (segmented) into three parts, with lengths proportional to the calculated proportions for each category. The x - axis will have the grade levels (4th, 5th, 6th) and the y - axis will represent the proportion (from 0 to 1).
(Note: Since we can't draw the chart here, we can describe the process. The actual chart would have three bars, one for each grade, and each bar split into three segments corresponding to Grades, Athletic, and Popular, with heights based on the proportions above.)
To determine if there is an association, we check if the distributions of the response variable (what is most important) differ across the levels of the explanatory variable (grade level). From the proportions calculated in part b, we can see that the proportion of students who chose each category (Grades, Athletic, Popular) is not exactly the same across 4th, 5th, and 6th grades. For example, the proportion of 5th - grade students who chose Athletic (0.3333) is higher than that of 4th - grade (0.2609) and 6th - grade (0.2815) students. The proportion of students who chose Grades also varies slightly across grades. Since the distributions of the response variable differ across grade levels, there is an association.

Snap & solve any problem in the app
Get step-by-step solutions on Sovi AI
Photo-based solutions with guided steps
Explore more problems and detailed explanations
Explanatory variable: Grade level (4th, 5th, 6th grade)
Response variable: What is most important to students (good grades, athletic ability, or being popular)