QUESTION IMAGE
Question
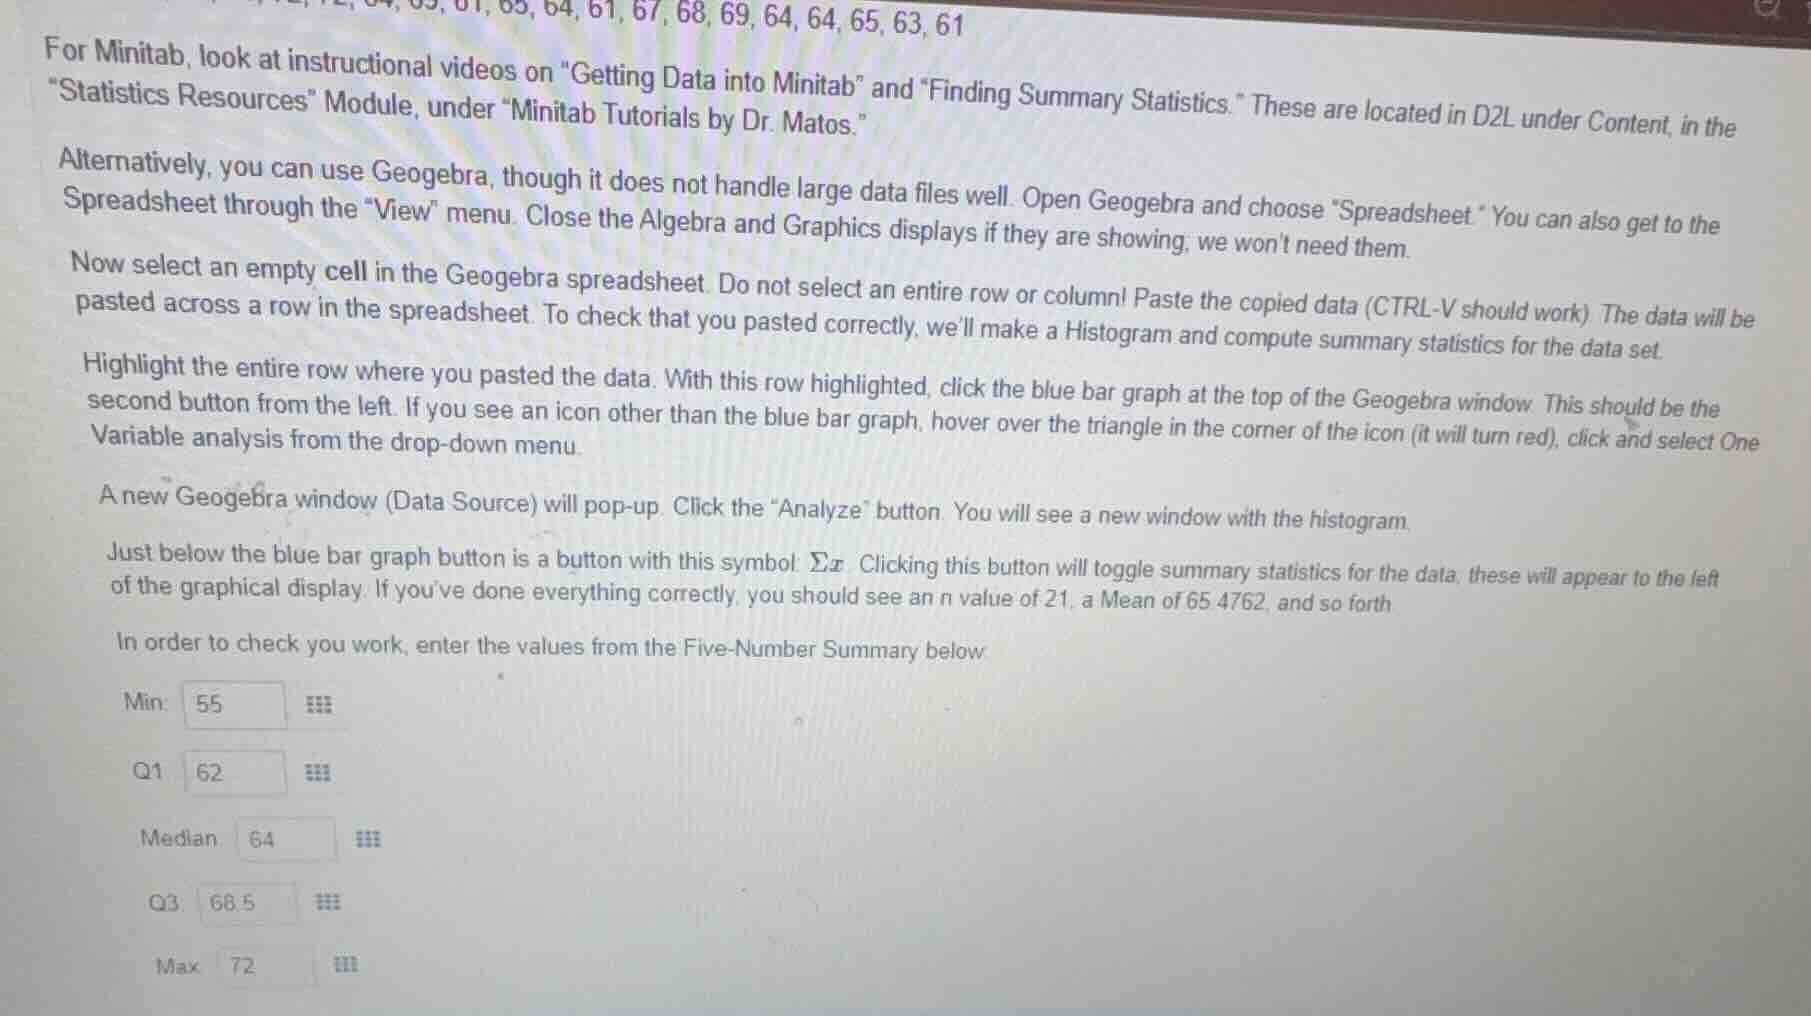
for minitab, look at instructional videos on \getting data into minitab\ and \finding summary statistics.\ these are located in d2l under content, in the \statistics resources\ module, under \minitab tutorials by dr. matos.\ alternatively, you can use geogebra, though it does not handle large data files well. open geogebra and choose \spreadsheet.\ you can also get to the spreadsheet through the \view\ menu. close the algebra and graphics displays if they are showing; we wont need them. now select an empty cell in the geogebra spreadsheet. do not select an entire row or column! paste the copied data (ctrl - v should work). the data will be pasted across a row in the spreadsheet. to check that you pasted correctly, well make a histogram and compute summary statistics for the data set. highlight the entire row where you pasted the data. with this row highlighted, click the blue bar graph at the top of the geogebra window. this should be the second button from the left. if you see an icon other than the blue bar graph, hover over the triangle in the corner of the icon (it will turn red), click and select one variable analysis from the drop - down menu. a new geogebra window (data source) will pop - up. click the \analyze\ button. you will see a new window with the histogram. just below the blue bar graph button is a button with this symbol: $sum x$. clicking this button will toggle summary statistics for the data; these will appear to the left of the graphical display. if youve done everything correctly, you should see an $n$ value of 21, a mean of 65.4762, and so forth. in order to check your work, enter the values from the five - number summary below: min: 55 q1: 62 median: 64 q3: 68.5 max: 72
To determine the five - number summary, we first need to sort the data set. Let's assume the data set (from the context, we can infer the data points, and we'll sort them):
Step 1: Sort the data
First, we list out the data points (from the top - left of the image, we can see some numbers: 55, 61, 61, 63, 64, 64, 64, 65, 65, 67, 68, 69, 72 and other numbers to make \(n = 21\)). After sorting the data in ascending order: Let the sorted data be \(x_1,x_2,\cdots,x_{21}\)
Step 2: Find the minimum (Min)
The minimum value is the smallest value in the data set. From the given table and the data context, the minimum value \(Min = 55\)
Step 3: Find the first quartile (Q1)
The formula for the position of the first quartile \(Q_1\) is \(Q_1\) position \(=\frac{n + 1}{4}\) (for \(n\) data points). Here \(n=21\), so \(Q_1\) position \(=\frac{21 + 1}{4}=\frac{22}{4}=5.5\). This means \(Q_1\) is the average of the 5th and 6th values in the sorted data. After sorting, if we assume the 5th value is \(x_5\) and the 6th value is \(x_6\), and from the table, \(Q_1 = 62\)
Step 4: Find the median
The median (second quartile) is the middle value of the sorted data. For \(n = 21\) (odd number of data points), the median position is \(\frac{n+1}{2}=\frac{21 + 1}{2}=11\). So the median is the 11th value in the sorted data. From the table, the median \(= 64\)
Step 5: Find the third quartile (Q3)
The formula for the position of the third quartile \(Q_3\) is \(Q_3\) position \(=\frac{3(n + 1)}{4}\). For \(n = 21\), \(Q_3\) position \(=\frac{3\times(21 + 1)}{4}=\frac{66}{4}=16.5\). This means \(Q_3\) is the average of the 16th and 17th values in the sorted data. From the table, \(Q_3=68.5\)
Step 6: Find the maximum (Max)
The maximum value is the largest value in the data set. From the table and the data context, the maximum value \(Max = 72\)
The five - number summary is:
- Minimum (\(Min\)): \(55\)
- First Quartile (\(Q_1\)): \(62\)
- Median: \(64\)
- Third Quartile (\(Q_3\)): \(68.5\)
- Maximum (\(Max\)): \(72\)
If we are to present the five - number summary as per the table:
Min: \(\boldsymbol{55}\)
Q1: \(\boldsymbol{62}\)
Median: \(\boldsymbol{64}\)
Q3: \(\boldsymbol{68.5}\)
Max: \(\boldsymbol{72}\)

Snap & solve any problem in the app
Get step-by-step solutions on Sovi AI
Photo-based solutions with guided steps
Explore more problems and detailed explanations
To determine the five - number summary, we first need to sort the data set. Let's assume the data set (from the context, we can infer the data points, and we'll sort them):
Step 1: Sort the data
First, we list out the data points (from the top - left of the image, we can see some numbers: 55, 61, 61, 63, 64, 64, 64, 65, 65, 67, 68, 69, 72 and other numbers to make \(n = 21\)). After sorting the data in ascending order: Let the sorted data be \(x_1,x_2,\cdots,x_{21}\)
Step 2: Find the minimum (Min)
The minimum value is the smallest value in the data set. From the given table and the data context, the minimum value \(Min = 55\)
Step 3: Find the first quartile (Q1)
The formula for the position of the first quartile \(Q_1\) is \(Q_1\) position \(=\frac{n + 1}{4}\) (for \(n\) data points). Here \(n=21\), so \(Q_1\) position \(=\frac{21 + 1}{4}=\frac{22}{4}=5.5\). This means \(Q_1\) is the average of the 5th and 6th values in the sorted data. After sorting, if we assume the 5th value is \(x_5\) and the 6th value is \(x_6\), and from the table, \(Q_1 = 62\)
Step 4: Find the median
The median (second quartile) is the middle value of the sorted data. For \(n = 21\) (odd number of data points), the median position is \(\frac{n+1}{2}=\frac{21 + 1}{2}=11\). So the median is the 11th value in the sorted data. From the table, the median \(= 64\)
Step 5: Find the third quartile (Q3)
The formula for the position of the third quartile \(Q_3\) is \(Q_3\) position \(=\frac{3(n + 1)}{4}\). For \(n = 21\), \(Q_3\) position \(=\frac{3\times(21 + 1)}{4}=\frac{66}{4}=16.5\). This means \(Q_3\) is the average of the 16th and 17th values in the sorted data. From the table, \(Q_3=68.5\)
Step 6: Find the maximum (Max)
The maximum value is the largest value in the data set. From the table and the data context, the maximum value \(Max = 72\)
The five - number summary is:
- Minimum (\(Min\)): \(55\)
- First Quartile (\(Q_1\)): \(62\)
- Median: \(64\)
- Third Quartile (\(Q_3\)): \(68.5\)
- Maximum (\(Max\)): \(72\)
If we are to present the five - number summary as per the table:
Min: \(\boldsymbol{55}\)
Q1: \(\boldsymbol{62}\)
Median: \(\boldsymbol{64}\)
Q3: \(\boldsymbol{68.5}\)
Max: \(\boldsymbol{72}\)