QUESTION IMAGE
Question
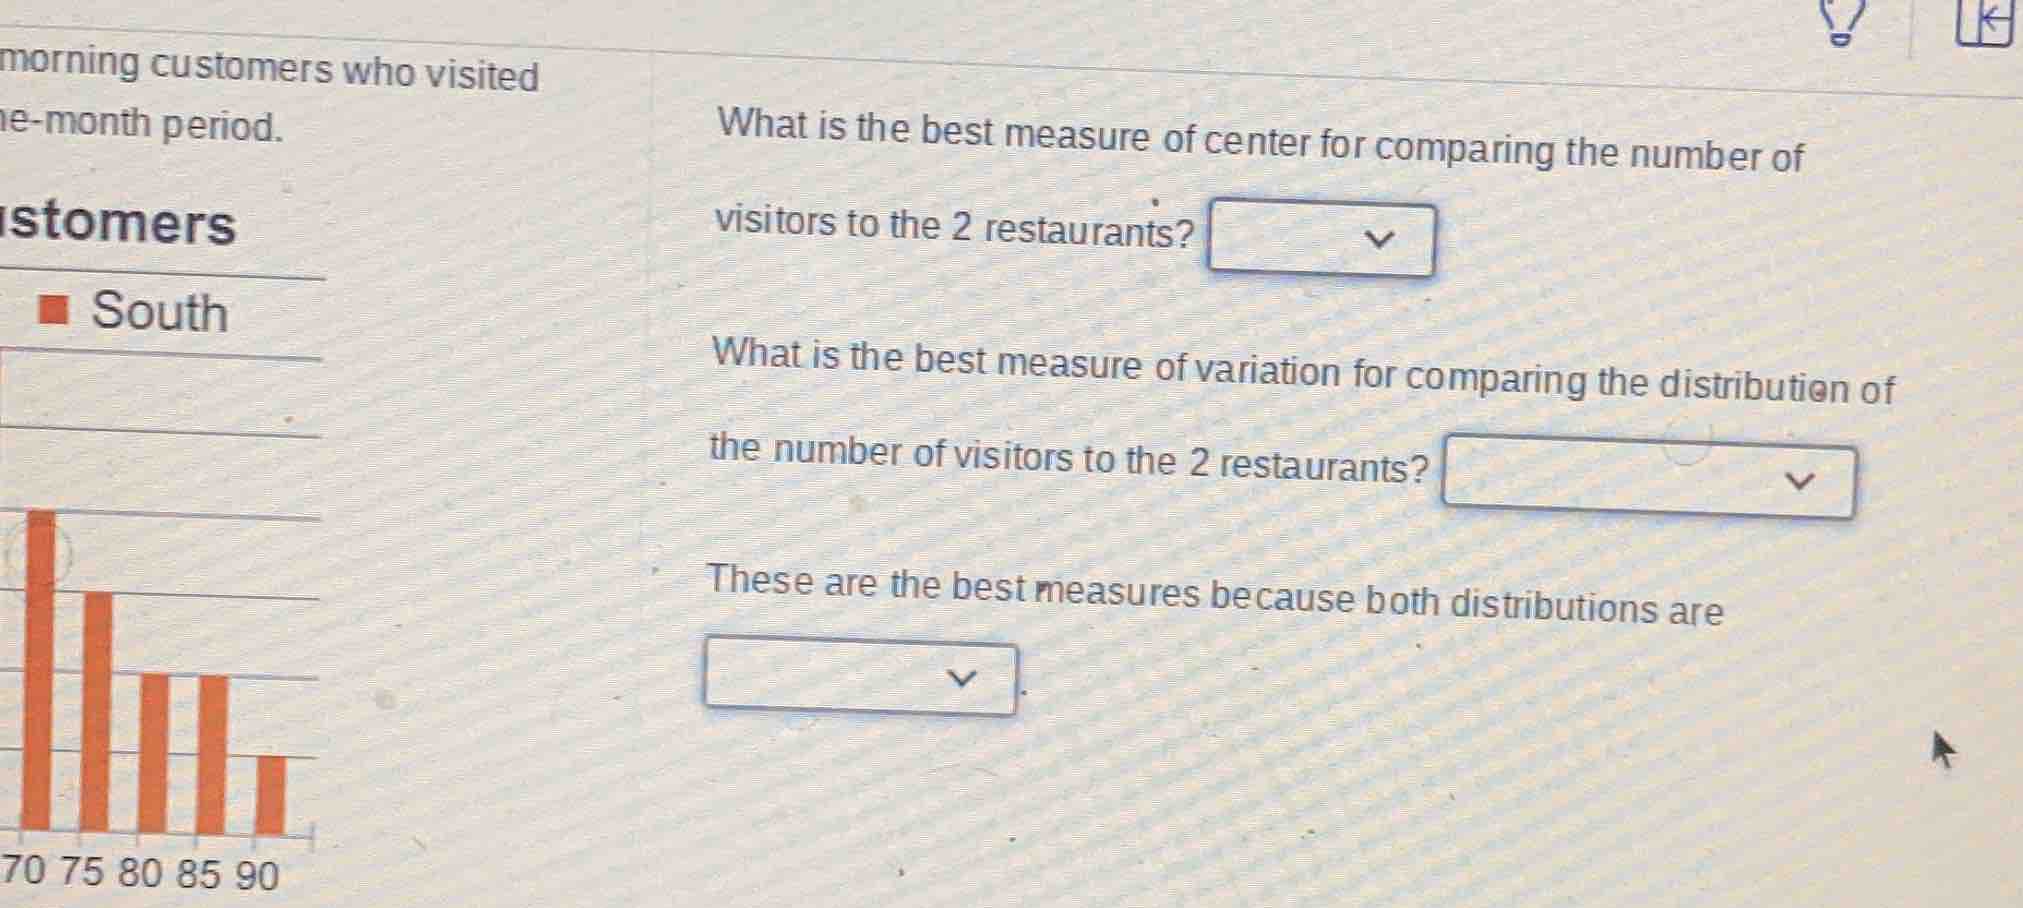
morning customers who visited
ne - month period.
what is the best measure of center for comparing the number of
visitors to the 2 restaurants?
what is the best measure of variation for comparing the distribution of
the number of visitors to the 2 restaurants?
these are the best measures because both distributions are
For the first question (best measure of center):
Step1: Recall measures of center
Measures of center include mean, median, mode. When distributions are symmetric, mean is good; when skewed, median is better. But if we assume the distributions (from the histogram-like graph) are not strongly skewed or have outliers, but for comparing two distributions, median is robust, but actually, if the distributions are symmetric (or we consider typical cases for restaurant visitors, but more importantly, when comparing two distributions, the median is a good measure of center, but wait, actually, the key here is that if the distributions are skewed, median is better, but the third part says "both distributions are..." so let's think: the best measure of center for comparing two distributions, especially if they are skewed or have outliers, median is better, but also, when distributions are symmetric, mean. But the common case for such problems (especially with histograms that might be skewed or not, but the standard answer for "best measure of center for comparing two groups" is median? Wait no, actually, the correct measure of center for comparing two distributions (like in box plots or histograms) is the median, and measure of variation is the interquartile range (IQR), because they are resistant to outliers. And the reason is that the distributions are skewed (or have outliers), so we use median (center) and IQR (variation), and the distributions are skewed (or non - symmetric).
Step2: Determine the best measure of center
For comparing two distributions, the median is a robust measure of center, especially when distributions may be skewed or have outliers. So the best measure of center is the median.
For the second question (best measure of variation):
Step1: Recall measures of variation
Measures of variation include range, standard deviation, interquartile range (IQR). Range is sensitive to outliers, standard deviation is sensitive to outliers and skewness. IQR is the difference between the third quartile (Q3) and first quartile (Q1), and it is robust to outliers.
Step2: Determine the best measure of variation
For comparing two distributions, especially when they may be skewed or have outliers, the interquartile range (IQR) is the best measure of variation as it is resistant to outliers.
For the third question (reason for these measures):
Step1: Recall properties of distributions
If a distribution is skewed (has a long tail) or has outliers, the mean and standard deviation are affected, while median and IQR are resistant. So the reason these (median and IQR) are the best measures is that both distributions are skewed (or have outliers), so we use resistant measures (median for center, IQR for variation).

Snap & solve any problem in the app
Get step-by-step solutions on Sovi AI
Photo-based solutions with guided steps
Explore more problems and detailed explanations
s:
- Best measure of center: Median
- Best measure of variation: Interquartile range (IQR)
- Reason: Skewed (or have outliers, so we use resistant measures)
(Note: The exact options in the dropdowns would be "Median" for the first, "Interquartile range" for the second, and "Skewed" (or "not symmetric", "have outliers") for the third. Since the problem has dropdowns, the answers are based on standard statistical concepts: median (center), interquartile range (variation), and the distributions are skewed (so we use resistant measures).)