QUESTION IMAGE
Question
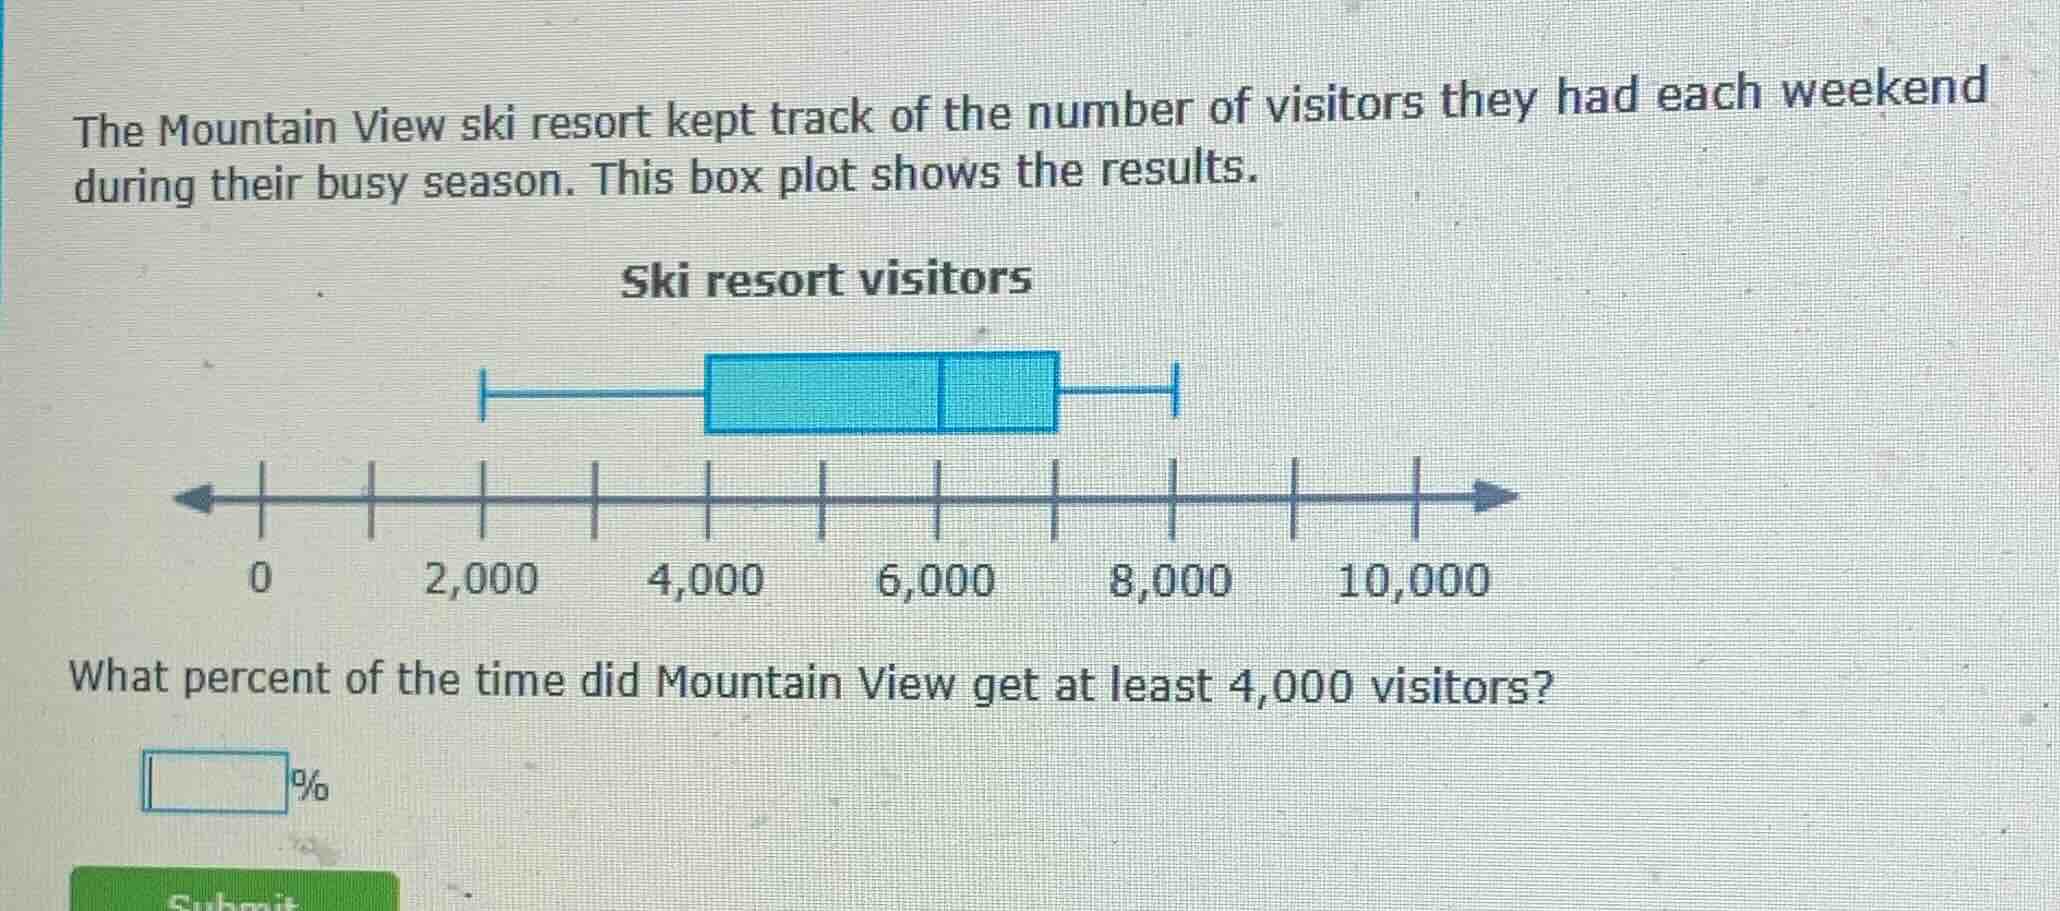
the mountain view ski resort kept track of the number of visitors they had each weekend during their busy season. this box plot shows the results.
ski resort visitors
what percent of the time did mountain view get at least 4,000 visitors?
%
Step1: Recall box plot properties
In a box plot, the box represents the interquartile range (IQR), containing the middle 50% of the data. The left edge of the box is the first quartile (\(Q_1\)), meaning 25% of the data is below \(Q_1\), and 75% is above (or at least) \(Q_1\). From the plot, the left edge of the box is at 4,000, so \(Q_1 = 4000\).
Step2: Calculate the percentage
Since 25% of the data is below 4,000, the percentage of data with at least 4,000 visitors is \(100\% - 25\% = 75\%\).

Snap & solve any problem in the app
Get step-by-step solutions on Sovi AI
Photo-based solutions with guided steps
Explore more problems and detailed explanations
75