QUESTION IMAGE
Question
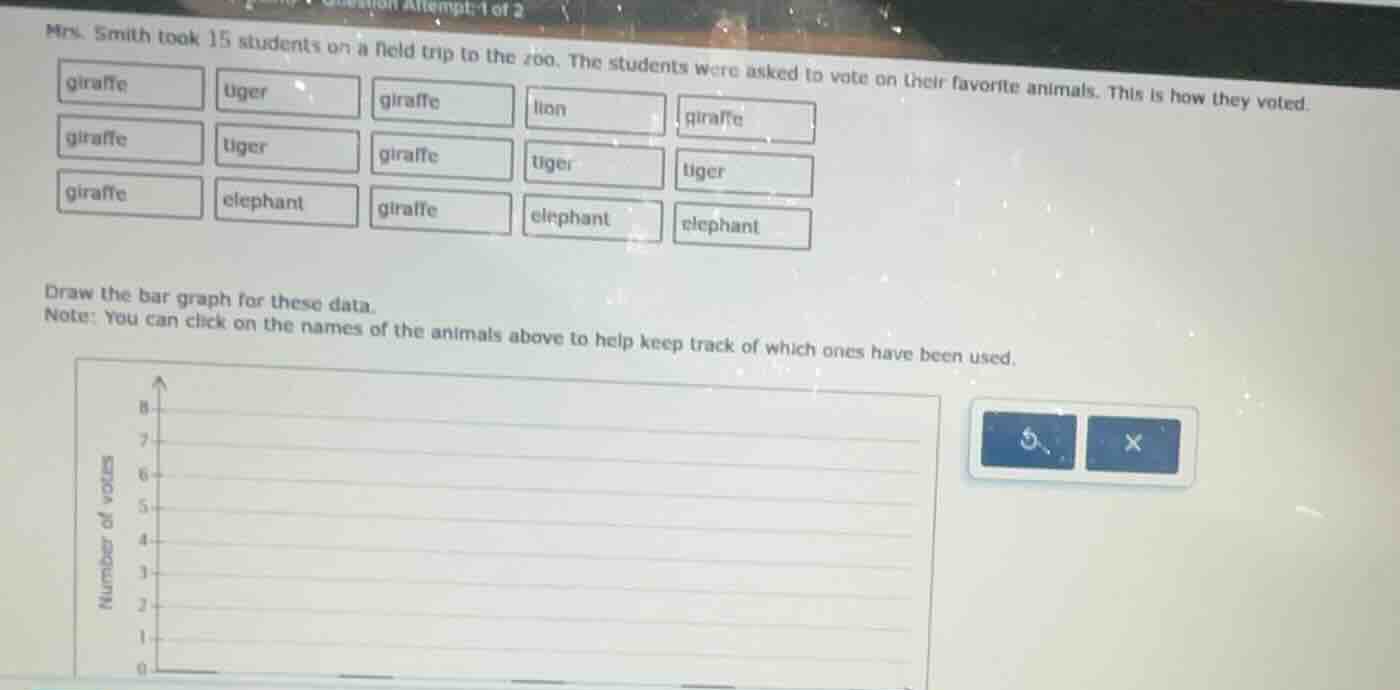
mrs. smith took 15 students on a field trip to the zoo. the students were asked to vote on their favorite animals. this is how they voted. giraffe tiger giraffe lion giraffe giraffe tiger giraffe tiger tiger giraffe elephant giraffe elephant elephant draw the bar graph for these data. note: you can click on the names of the animals above to help keep track of which ones have been used.
Step1: Tally votes per animal
Count each animal's occurrences:
- Giraffe: $\text{Count} = 7$
- Tiger: $\text{Count} = 4$
- Lion: $\text{Count} = 1$
- Elephant: $\text{Count} = 3$
Step2: Match counts to bar graph
Assign each animal to an x-axis category, then draw bars to the corresponding vote count on the y-axis.

Snap & solve any problem in the app
Get step-by-step solutions on Sovi AI
Photo-based solutions with guided steps
Explore more problems and detailed explanations
To create the bar graph:
- Label the x-axis with the animal names: Giraffe, Tiger, Elephant, Lion
- Draw bars with the following heights:
- Giraffe: Bar reaches 7 on the y-axis
- Tiger: Bar reaches 4 on the y-axis
- Elephant: Bar reaches 3 on the y-axis
- Lion: Bar reaches 1 on the y-axis