QUESTION IMAGE
Question
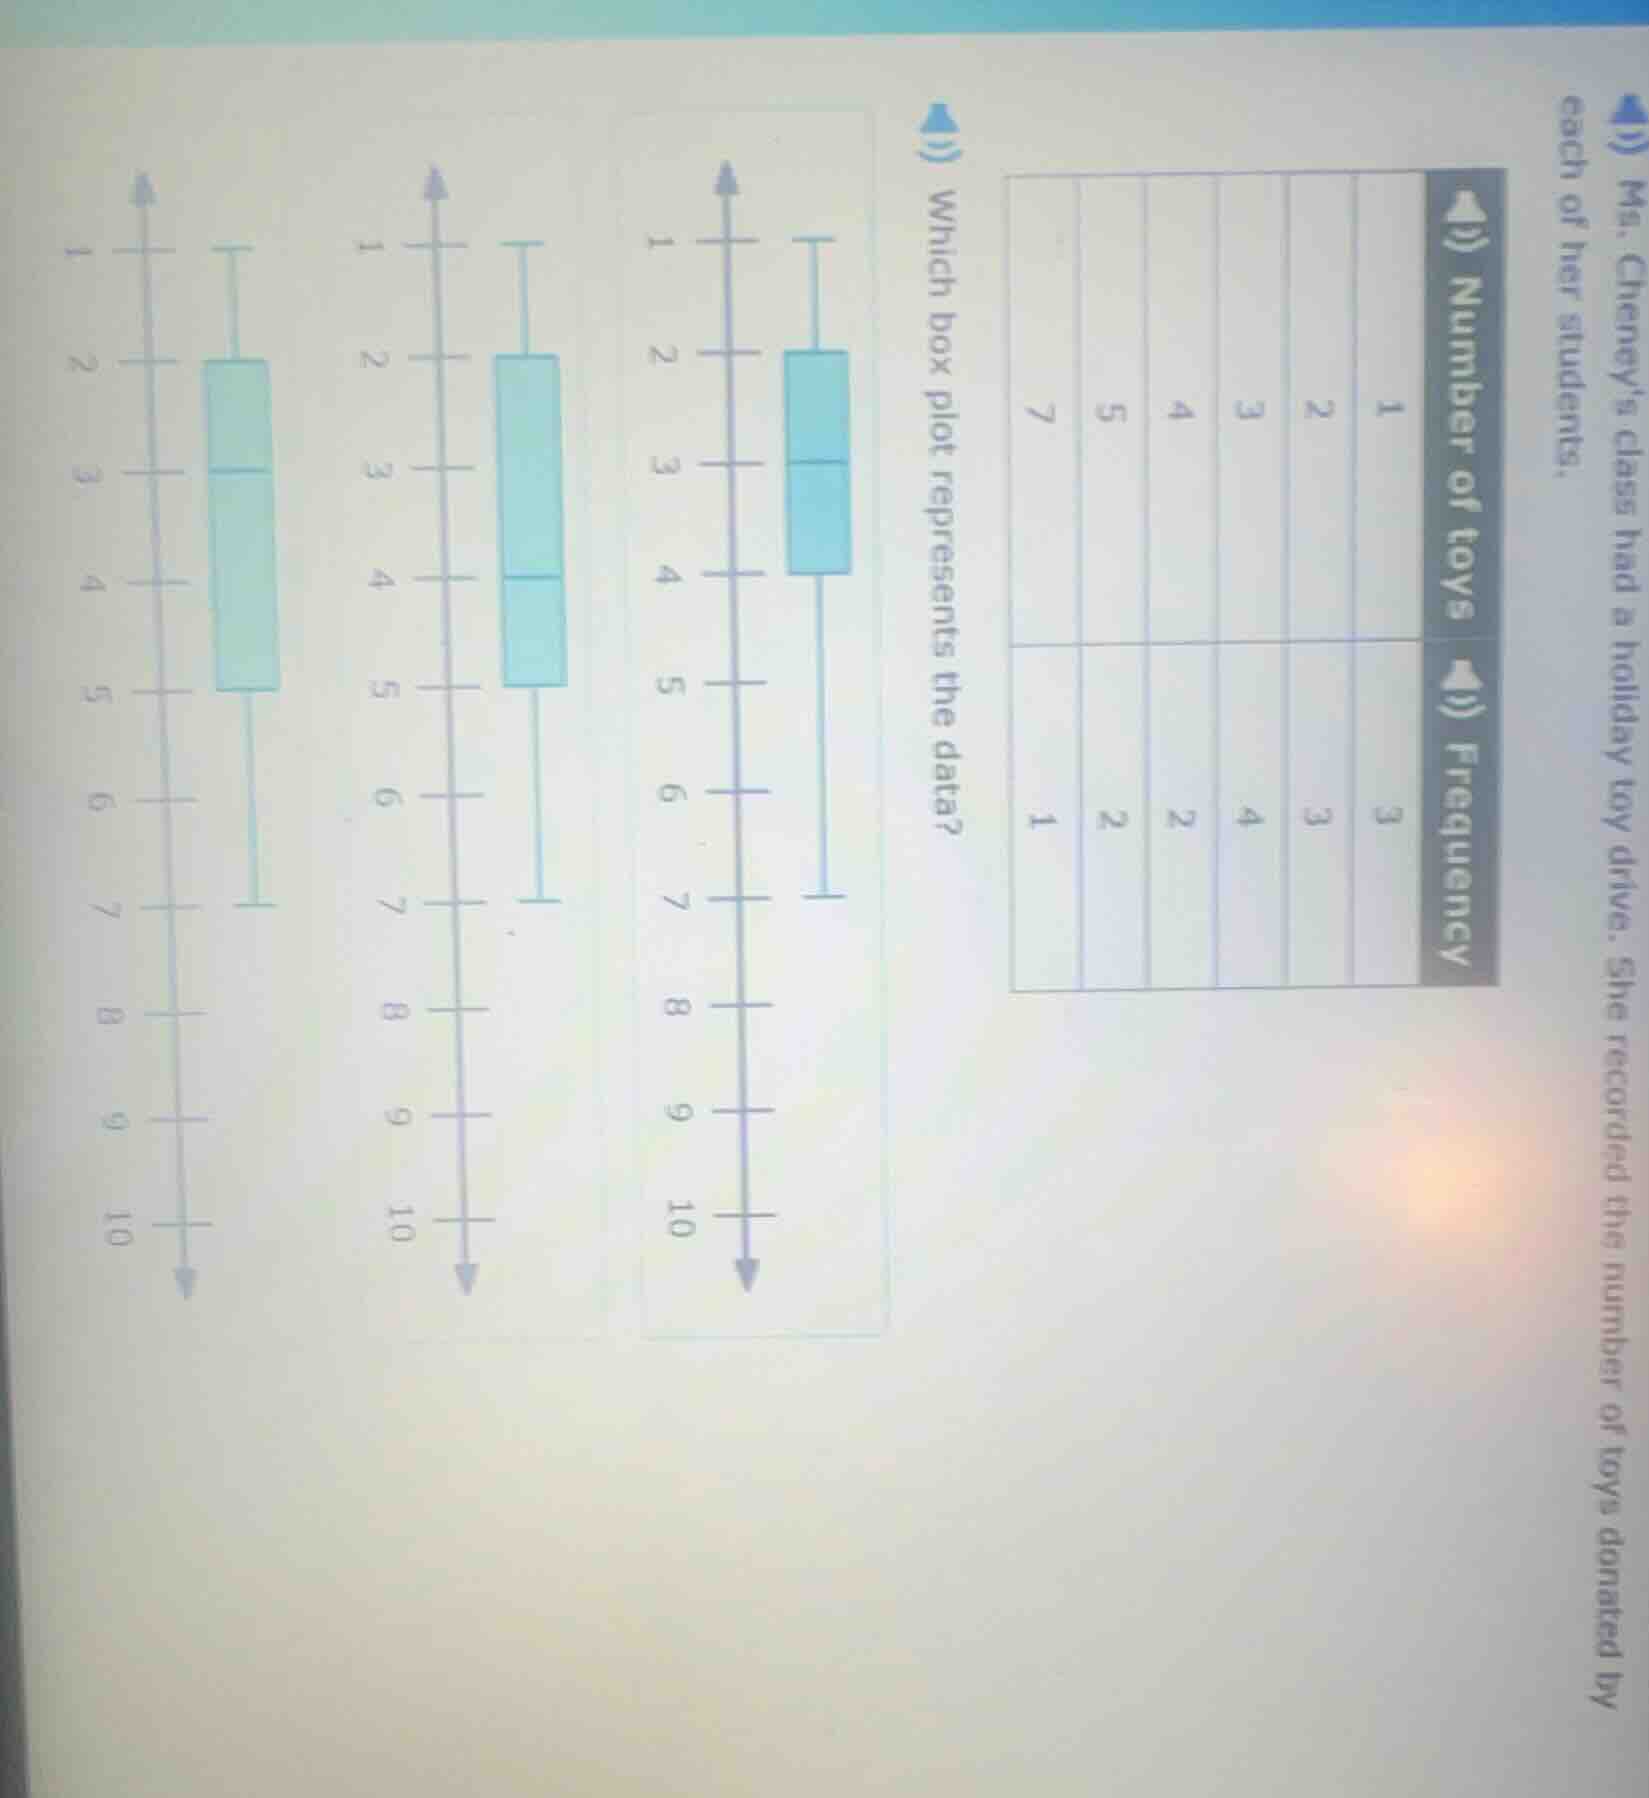
ms. cheneys class had a holiday toy drive. she recorded the number of toys donated by each of her students.
number of toys | frequency
1 | 3
2 | 3
3 | 4
4 | 2
5 | 2
7 | 1
which box plot represents the data?
Step1: List out all data points
First, we expand the frequency table to get the list of data points. For number of toys \( x \) with frequency \( f \), we repeat \( x \) \( f \) times.
- Toys = 1, Frequency = 3: So we have three 1s: \( 1, 1, 1 \)
- Toys = 2, Frequency = 3: Three 2s: \( 2, 2, 2 \)
- Toys = 3, Frequency = 4: Four 3s: \( 3, 3, 3, 3 \)
- Toys = 4, Frequency = 2: Two 4s: \( 4, 4 \)
- Toys = 5, Frequency = 2: Two 5s: \( 5, 5 \)
- Toys = 7, Frequency = 1: One 7: \( 7 \)
Combining all, the data set is: \( 1, 1, 1, 2, 2, 2, 3, 3, 3, 3, 4, 4, 5, 5, 7 \)
Step2: Find the minimum, Q1, median (Q2), Q3, maximum
- Minimum (Min): The smallest value in the data set. From the data, \( \text{Min} = 1 \)
- Maximum (Max): The largest value. From the data, \( \text{Max} = 7 \)
- Median (Q2): The middle value of the ordered data. There are \( n = 3 + 3 + 4 + 2 + 2 + 1 = 15 \) data points (odd number). The median is the \( \frac{n + 1}{2} = \frac{15 + 1}{2} = 8^\text{th} \) term.
Ordered data: \( 1, 1, 1, 2, 2, 2, 3, 3, 3, 3, 4, 4, 5, 5, 7 \)
The 8th term is \( 3 \), so \( \text{Median} = 3 \)
- Q1 (First Quartile): The median of the lower half (excluding the median if \( n \) is odd). The lower half has the first \( \frac{n - 1}{2} = 7 \) terms: \( 1, 1, 1, 2, 2, 2, 3 \). The median of these 7 terms is the 4th term: \( 2 \), so \( \text{Q1} = 2 \)
- Q3 (Third Quartile): The median of the upper half. The upper half has the last 7 terms: \( 3, 3, 3, 4, 4, 5, 5 \). The median of these 7 terms is the 4th term: \( 4 \), so \( \text{Q3} = 4 \)
Now, a box plot is defined by:
- Whisker from Min to Q1
- Box from Q1 to Q3, with a line at the median (Q2)
- Whisker from Q3 to Max
So the box plot should have:
- Min = 1, Q1 = 2, Median = 3, Q3 = 4, Max = 7
Looking at the three box plots (from the image), we check which one has these values. The first box plot (leftmost) has Min=1, Q1=2, Median=3, Q3=4, Max=7 (since the whiskers go from 1 to 7, box from 2 to 4, median at 3). Wait, wait—wait, let's recheck the max. Wait, in our data, the max is 7. Wait, but in the box plots, the third one (rightmost) has max at 7? Wait no, let's re-express the data. Wait, the data set is \( 1,1,1,2,2,2,3,3,3,3,4,4,5,5,7 \). So the max is 7. Now, let's check the box plots:
First box plot (left):
- Min: 1, Max: 7 (whiskers from 1 to 7)
- Q1: 2 (start of box)
- Median: 3 (line in box)
- Q3: 4 (end of box)
Second box plot (middle):
- Min: 1, Max: 7 (whiskers from 1 to 7)
- Q1: 2, Median: 4, Q3: 5? No, that doesn't match.
Third box plot (right):
- Min: 1, Max: 7, but box from 2 to 4? Wait no, maybe I made a mistake. Wait, let's recalculate Q1, Q2, Q3 properly.
Wait, \( n = 15 \) data points.
- Position of Q1: \( \frac{n + 1}{4} = \frac{15 + 1}{4} = 4^\text{th} \) term (since quartiles can be calculated as \( \frac{n + 1}{4} \) for Q1, \( \frac{2(n + 1)}{4} = \frac{n + 1}{2} \) for Q2, \( \frac{3(n + 1)}{4} = 12^\text{th} \) term for Q3).
Wait, let's use the method for odd \( n \):
- Q1: median of the first \( \frac{n - 1}{2} = 7 \) terms (positions 1–7: \( 1,1,1,2,2,2,3 \)) → the 4th term is 2 (correct).
- Q2: median of all 15 terms → 8th term is 3 (correct).
- Q3: median of the last \( \frac{n - 1}{2} = 7 \) terms (positions 9–15: \( 3,3,3,4,4,5,5 \)) → the 12th term (position 9 + 3 = 12? Wait, positions 9–15: terms are \( 3,3,3,4,4,5,5 \) (7 terms). The median is the 4th term (since 7 terms: positions 1–7 in the sublist, 4th term is 4 (correct).
So Q1=2, Q2=3, Q3=4, Min=1, Max=7.
Now, looking at the box plots:
- First box plot: whi…

Snap & solve any problem in the app
Get step-by-step solutions on Sovi AI
Photo-based solutions with guided steps
Explore more problems and detailed explanations
The left - most box plot (the first one among the three) represents the data.