QUESTION IMAGE
Question
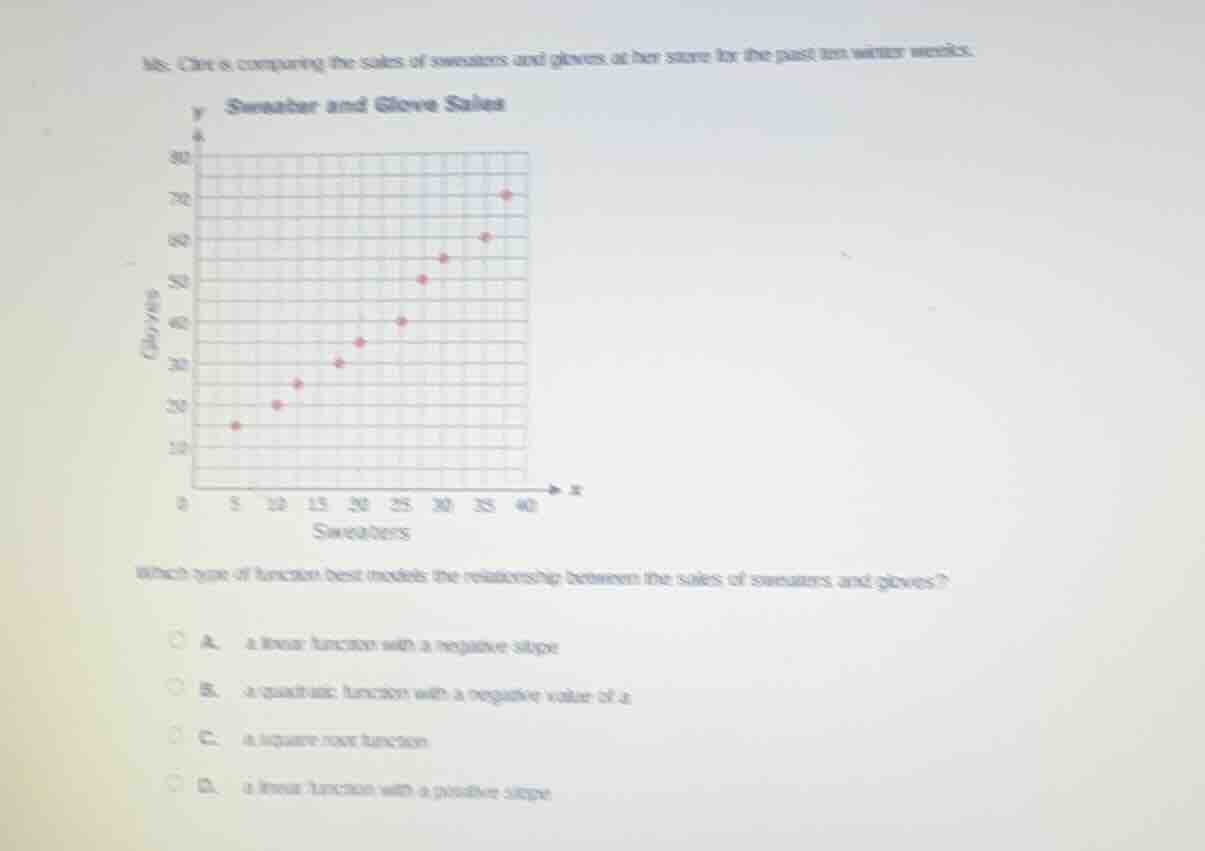
ms. chin is comparing the sales of sweaters and gloves at her store for the past ten winter weeks.
sweater and glove sales
which type of function best models the relationship between the sales of sweaters and gloves?
a. a linear function with a negative slope
b. a quadratic function with a negative value of a
c. a square root function
d. a linear function with a positive slope
Step1: Analyze scatter plot trend
Observe that as x (sweaters) increases, y (gloves) increases, and points follow a straight, upward pattern.
Step2: Match trend to function type
A linear function with positive slope has a straight, upward trend, matching the plot. Other options (negative slope, quadratic, square root) do not fit the pattern.

Snap & solve any problem in the app
Get step-by-step solutions on Sovi AI
Photo-based solutions with guided steps
Explore more problems and detailed explanations
D. a linear function with a positive slope