QUESTION IMAGE
Question
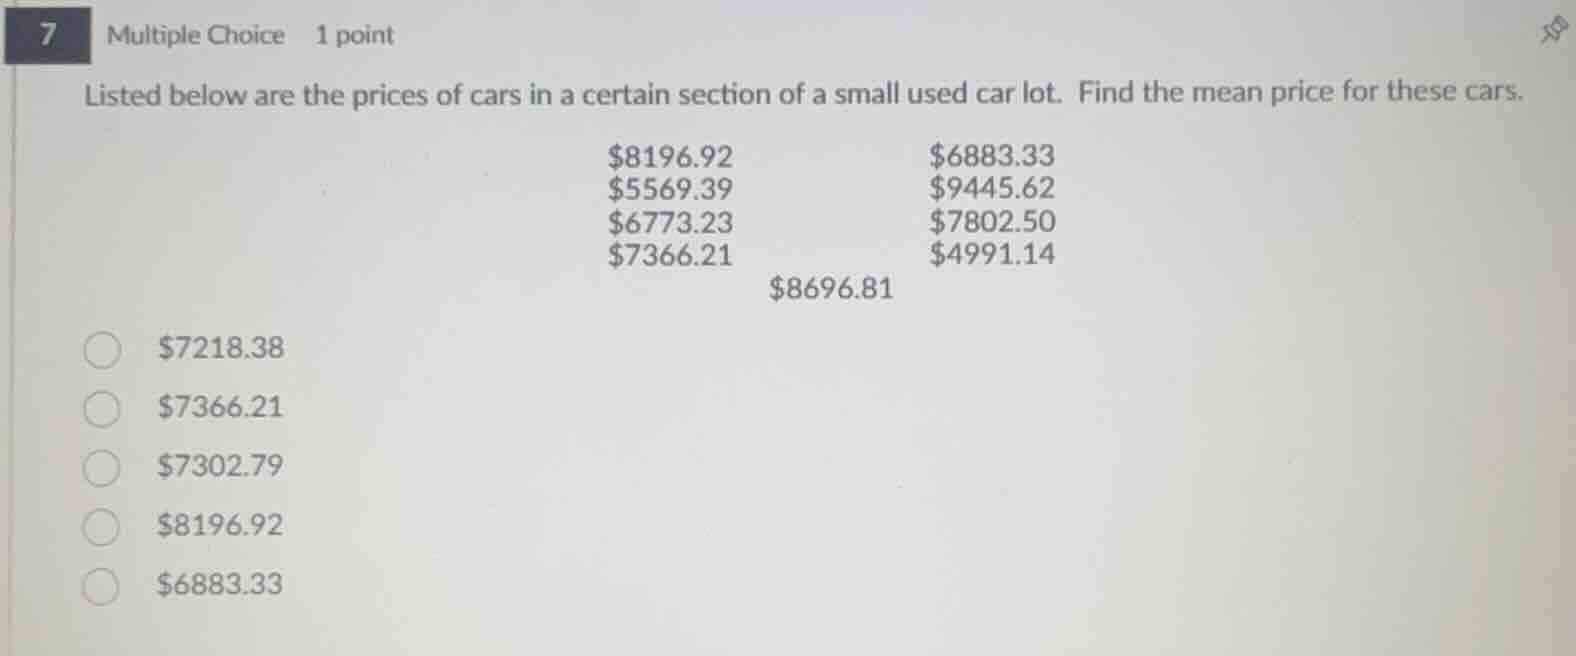
7 multiple choice 1 point listed below are the prices of cars in a certain section of a small used car lot. find the mean price for these cars. $8196.92 $6883.33 $5569.39 $9445.62 $6773.23 $7802.50 $7366.21 $4991.14 $8696.81 $7218.38 $7366.21 $7302.79 $8196.92 $6883.33
Step1: Count the number of data points
We have the following car prices: $8196.92, $6883.33, $5569.39, $9445.62, $6773.23, $7802.50, $7366.21, $4991.14, $8696.81. Let's count them: 1. $8196.92, 2. $6883.33, 3. $5569.39, 4. $9445.62, 5. $6773.23, 6. $7802.50, 7. $7366.21, 8. $4991.14, 9. $8696.81. So there are \( n = 9 \) data points.
Step2: Sum all the prices
We calculate the sum \( \sum x \) of all the prices:
\[
\]
Step3: Calculate the mean
The formula for the mean \( \bar{x} \) is \( \bar{x}=\frac{\sum x}{n} \). We know \( \sum x = 65725.15 \) and \( n = 9 \), so:
\[
\bar{x}=\frac{65725.15}{9} \approx 7302.79
\]

Snap & solve any problem in the app
Get step-by-step solutions on Sovi AI
Photo-based solutions with guided steps
Explore more problems and detailed explanations
$7302.79$