QUESTION IMAGE
Question
3 multiple choice 0.5 points
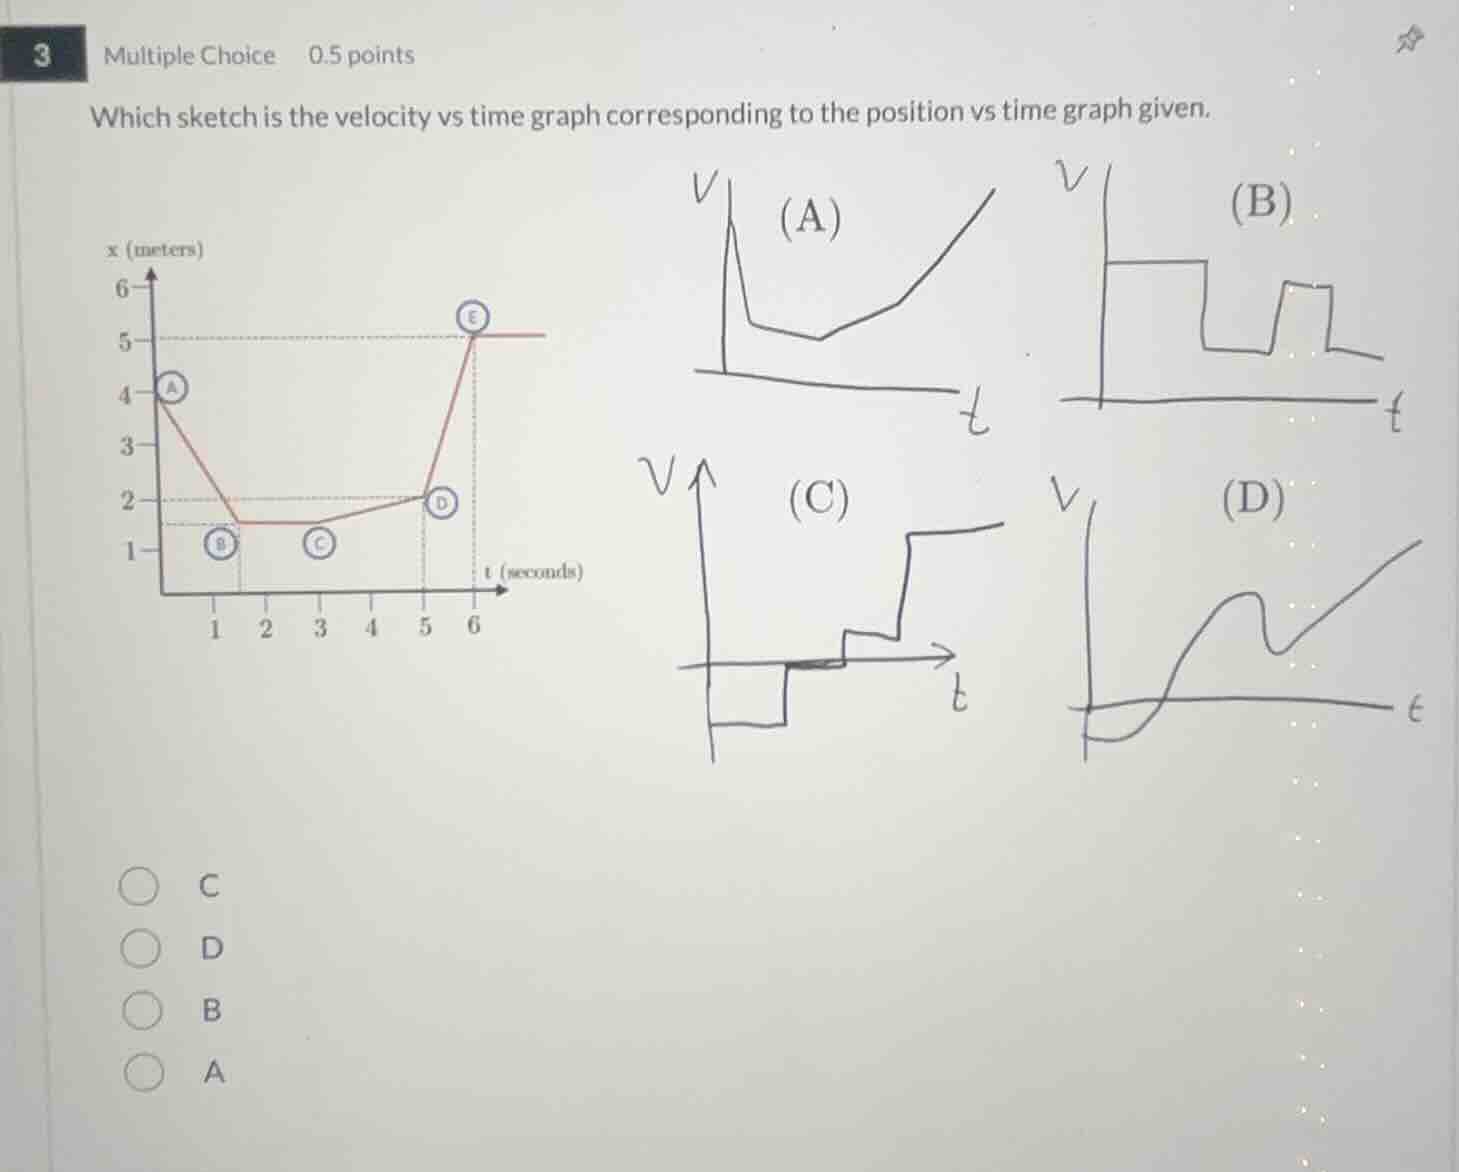
which sketch is the velocity vs time graph corresponding to the position vs time graph given.
options:
c
d
b
a
Step1: Analyze segment A-B
Velocity is slope of $x(t)$: $\frac{1.5-4}{1-0}=-2.5$ (negative constant)
Step2: Analyze segment B-C
Velocity is slope of $x(t)$: $\frac{1.5-1.5}{3-1}=0$ (zero constant)
Step3: Analyze segment C-D
Velocity is slope of $x(t)$: $\frac{2-1.5}{5-3}=0.25$ (positive small constant)
Step4: Analyze segment D-E
Velocity is slope of $x(t)$: $\frac{5-2}{6-5}=3$ (positive large constant)
Step5: Analyze segment E-end
Velocity is slope of $x(t)$: $\frac{5-5}{t>6}=0$ (zero constant)
Step6: Match to options
Only option C has negative constant, zero, small positive constant, large positive constant, zero velocity segments in order.

Snap & solve any problem in the app
Get step-by-step solutions on Sovi AI
Photo-based solutions with guided steps
Explore more problems and detailed explanations
C. The velocity vs time graph matching the position vs time graph's slope changes