QUESTION IMAGE
Question
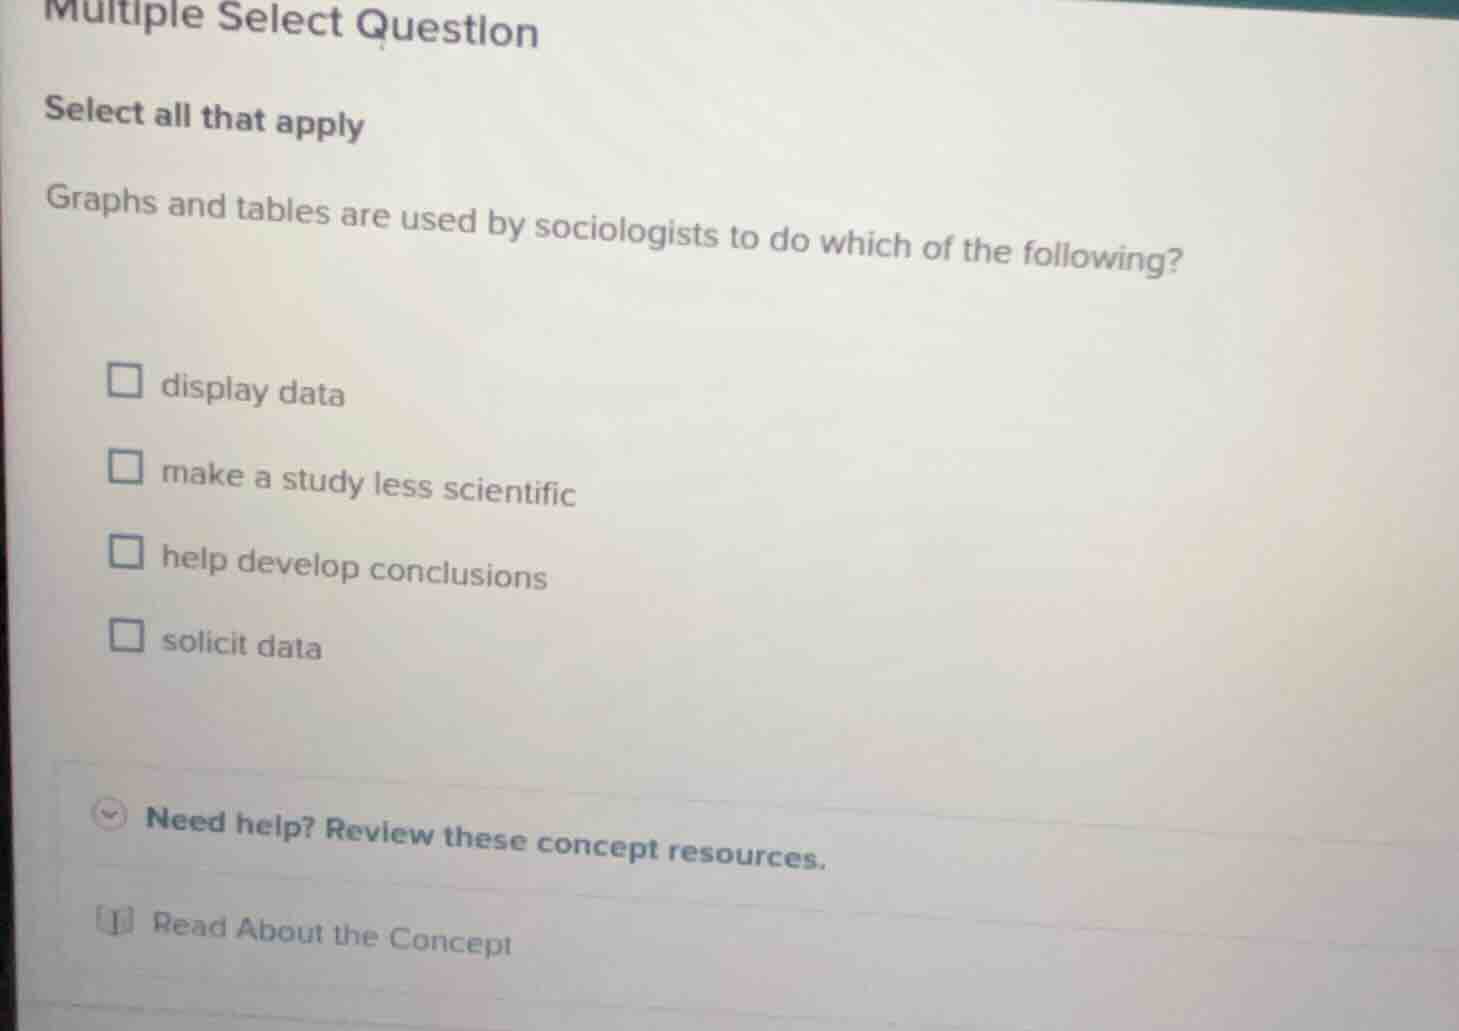
multiple select question
select all that apply
graphs and tables are used by sociologists to do which of the following?
display data
make a study less scientific
help develop conclusions
solicit data
need help? review these concept resources.
read about the concept
Brief Explanations
- Graphs and tables are core tools for presenting collected research data clearly, so they are used to display data.
- Organized data in graphs/tables helps identify patterns, which supports drawing evidence-based conclusions.
- They enhance, rather than reduce, a study's scientific rigor, so the option about making a study less scientific is incorrect.
- Soliciting data refers to collecting new data, which graphs/tables do not do; they work with already gathered data.

Snap & solve any problem in the app
Get step-by-step solutions on Sovi AI
Photo-based solutions with guided steps
Explore more problems and detailed explanations
- display data
- help develop conclusions