QUESTION IMAGE
Question
name
lesson quiz
3-4
name
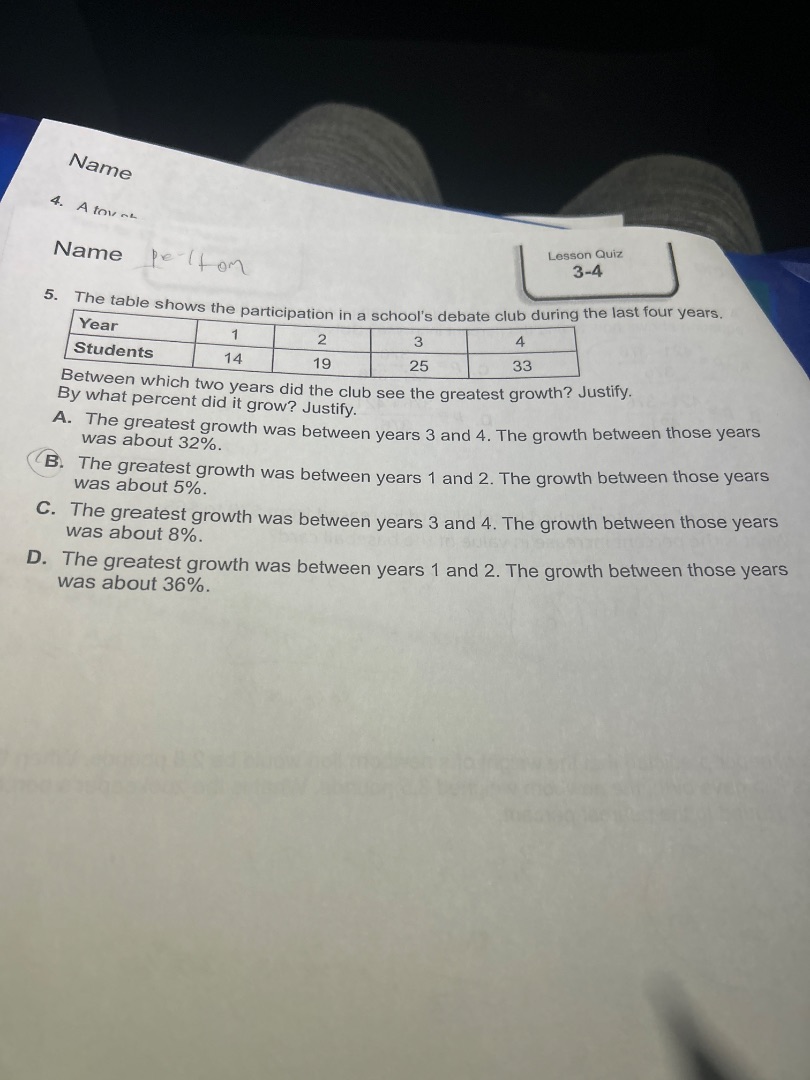
- the table shows the participation in a schools debate club during the last four years.
| year | 1 | 2 | 3 | 4 |
|---|
between which two years did the club see the greatest growth? justify.
by what percent did it grow? justify.
a. the greatest growth was between years 3 and 4. the growth between those years was about 32%.
b. the greatest growth was between years 1 and 2. the growth between those years was about 5%.
c. the greatest growth was between years 3 and 4. the growth between those years was about 8%.
d. the greatest growth was between years 1 and 2. the growth between those years was about 36%.
Step1: Calculate Year1-2 growth
Percent growth: $\frac{19-14}{14} \times 100\% = \frac{5}{14} \times 100\% \approx 35.71\%$
Step2: Calculate Year2-3 growth
Percent growth: $\frac{25-19}{19} \times 100\% = \frac{6}{19} \times 100\% \approx 31.58\%$
Step3: Calculate Year3-4 growth
Percent growth: $\frac{33-25}{25} \times 100\% = \frac{8}{25} \times 100\% = 32\%$
Step4: Compare growth values
$35.71\% > 32\% > 31.58\%$, so Year1-2 is highest.

Snap & solve any problem in the app
Get step-by-step solutions on Sovi AI
Photo-based solutions with guided steps
Explore more problems and detailed explanations
D. The greatest growth was between years 1 and 2. The growth between those years was about 36%.