QUESTION IMAGE
Question
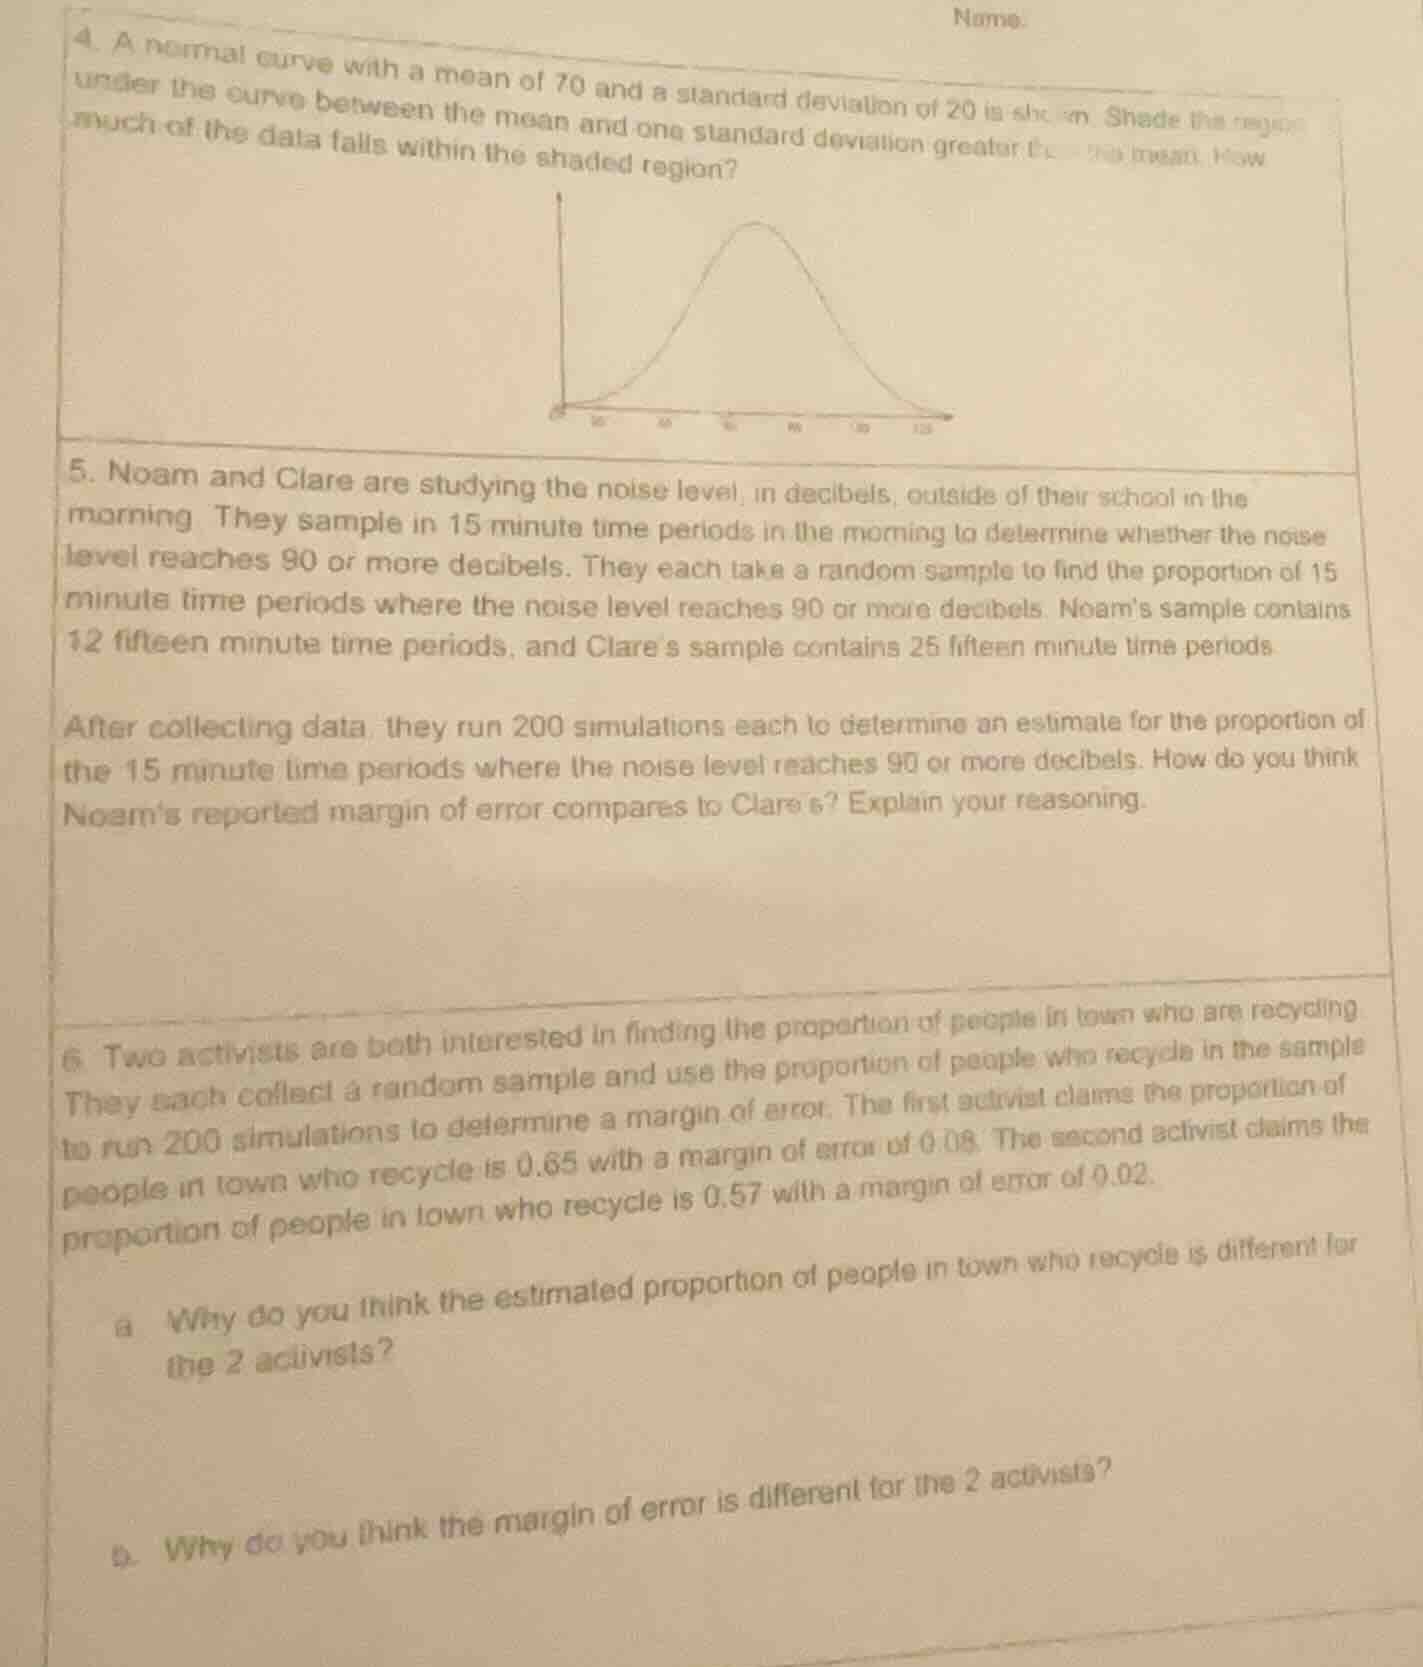
- a normal curve with a mean of 70 and a standard deviation of 20 is shown. shade the region under the curve between the mean and one standard deviation greater than the mean. how much of the data falls within the shaded region?
(there is an image of a normal curve here)
- noam and clare are studying the noise level, in decibels, outside of their school in the morning. they sample in 15 - minute time periods in the morning to determine whether the noise level reaches 90 or more decibels. they each take a random sample to find the proportion of 15 - minute time periods where the noise level reaches 90 or more decibels. noam’s sample contains 12 fifteen - minute time periods, and clare’s sample contains 25 fifteen - minute time periods.
after collecting data, they run 200 simulations each to determine an estimate for the proportion of the 15 - minute time periods where the noise level reaches 90 or more decibels. how do you think noam’s reported margin of error compares to clare’s? explain your reasoning.
- two activists are both interested in finding the proportion of people in town who are recycling. they each collect a random sample and use the proportion of people who recycle in the sample to run 200 simulations to determine a margin of error. the first activist claims the proportion of people in town who recycle is 0.65 with a margin of error of 0.08. the second activist claims the proportion of people in town who recycle is 0.57 with a margin of error of 0.02.
a. why do you think the estimated proportion of people in town who recycle is different for the 2 activists?
b. why do you think the margin of error is different for the 2 activists?
---
Question 4:
Step1: Recall empirical rule for normal curves
For a normal distribution, ~68% of data lies within $\mu\pm\sigma$.
Step2: Calculate half the 68% range
$\frac{68\%}{2}=34\%$
---
Question 5:
Step1: Relate sample size to margin of error
Margin of error is inversely related to sample size: $\text{Margin of Error} \propto \frac{1}{\sqrt{n}}$
Step2: Compare sample sizes
Noam's $n=12$, Clare's $n=25$. Since $12<25$, Noam's margin of error is larger.
---
Question 6a:
Step1: Identify random sampling property
Random samples from the same population will naturally have different sample proportions due to chance variation in which individuals are selected.
---
Question 6b:
Step1: Link sample size to margin of error
Larger sample sizes reduce sampling variability, leading to a smaller margin of error. The second activist likely used a much larger sample than the first.

Snap & solve any problem in the app
Get step-by-step solutions on Sovi AI
Photo-based solutions with guided steps
Explore more problems and detailed explanations
Question 4:
Approximately 34% of the data
Question 5:
Noam's margin of error will be larger than Clare's.
Question 6a:
The estimated proportions differ due to random sampling variability.
Question 6b:
The margins of error differ likely due to different sample sizes.