QUESTION IMAGE
Question
number
4
3
2
1
0
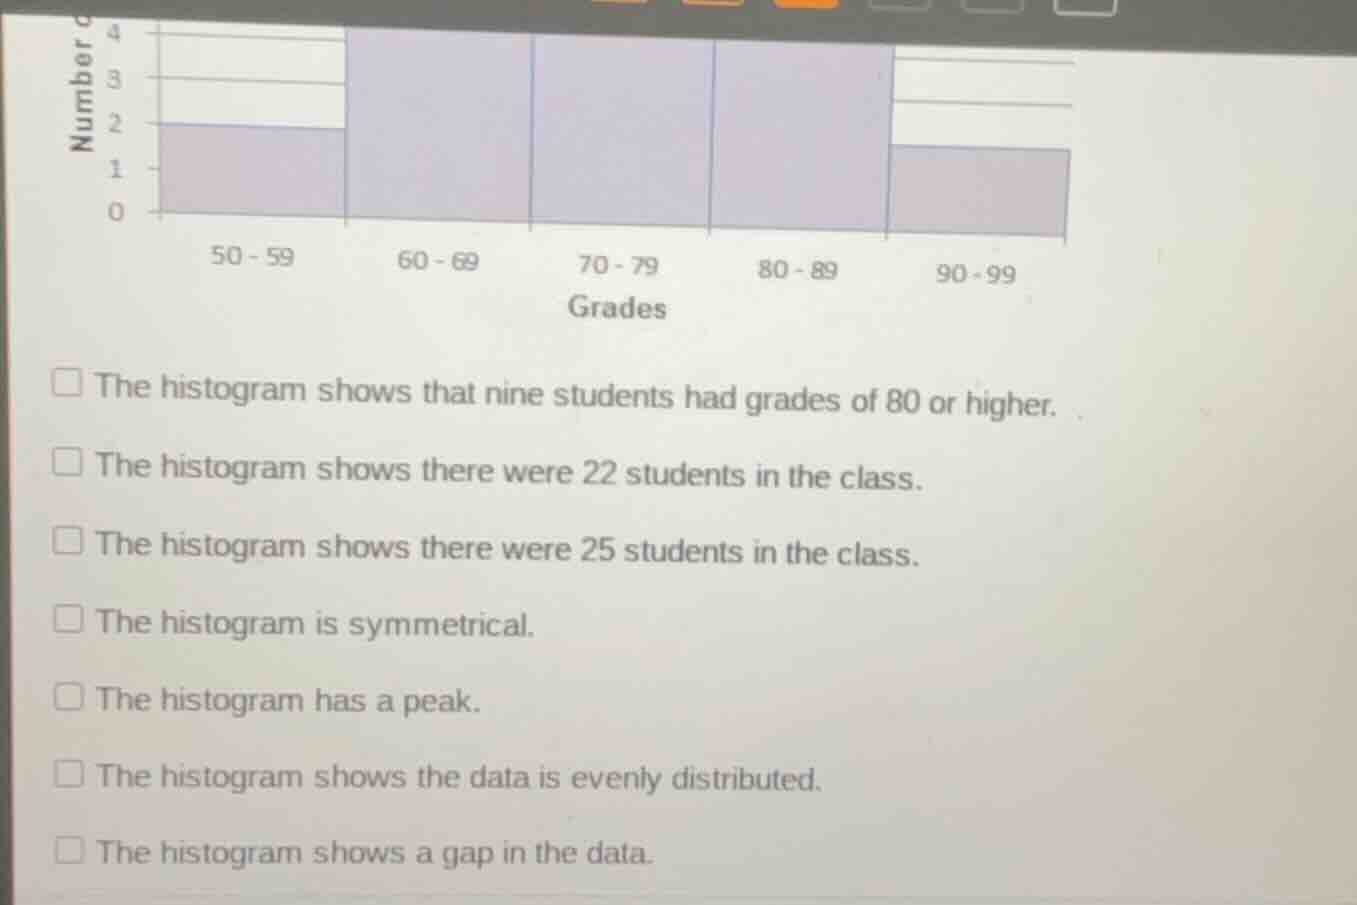
50 - 59 60 - 69 70 - 79 80 - 89 90 - 99
grades
the histogram shows that nine students had grades of 80 or higher.
the histogram shows there were 22 students in the class.
the histogram shows there were 25 students in the class.
the histogram is symmetrical.
the histogram has a peak.
the histogram shows the data is evenly distributed.
the histogram shows a gap in the data.
Step1: Count students with grades ≥80
Add counts for 80-89 and 90-99: $4 + 1 = 5$
Step2: Calculate total class size
Sum all grade bin counts: $2 + 4 + 4 + 4 + 1 = 15$
Step3: Check symmetry
Left side (2,4) vs right (4,1) are not mirrored.
Step4: Check for a peak
The bins 60-69,70-79,80-89 all have the highest count (4), so there is a peak (plateau peak).
Step5: Check even distribution
Counts (2,4,4,4,1) are not equal.
Step6: Check for data gaps
All consecutive grade ranges are present with non-zero counts.

Snap & solve any problem in the app
Get step-by-step solutions on Sovi AI
Photo-based solutions with guided steps
Explore more problems and detailed explanations
The histogram has a peak.