QUESTION IMAGE
Question
online hw: section 1.2 average rates of change
score: 1.75/13 answered: 2/13
question 3
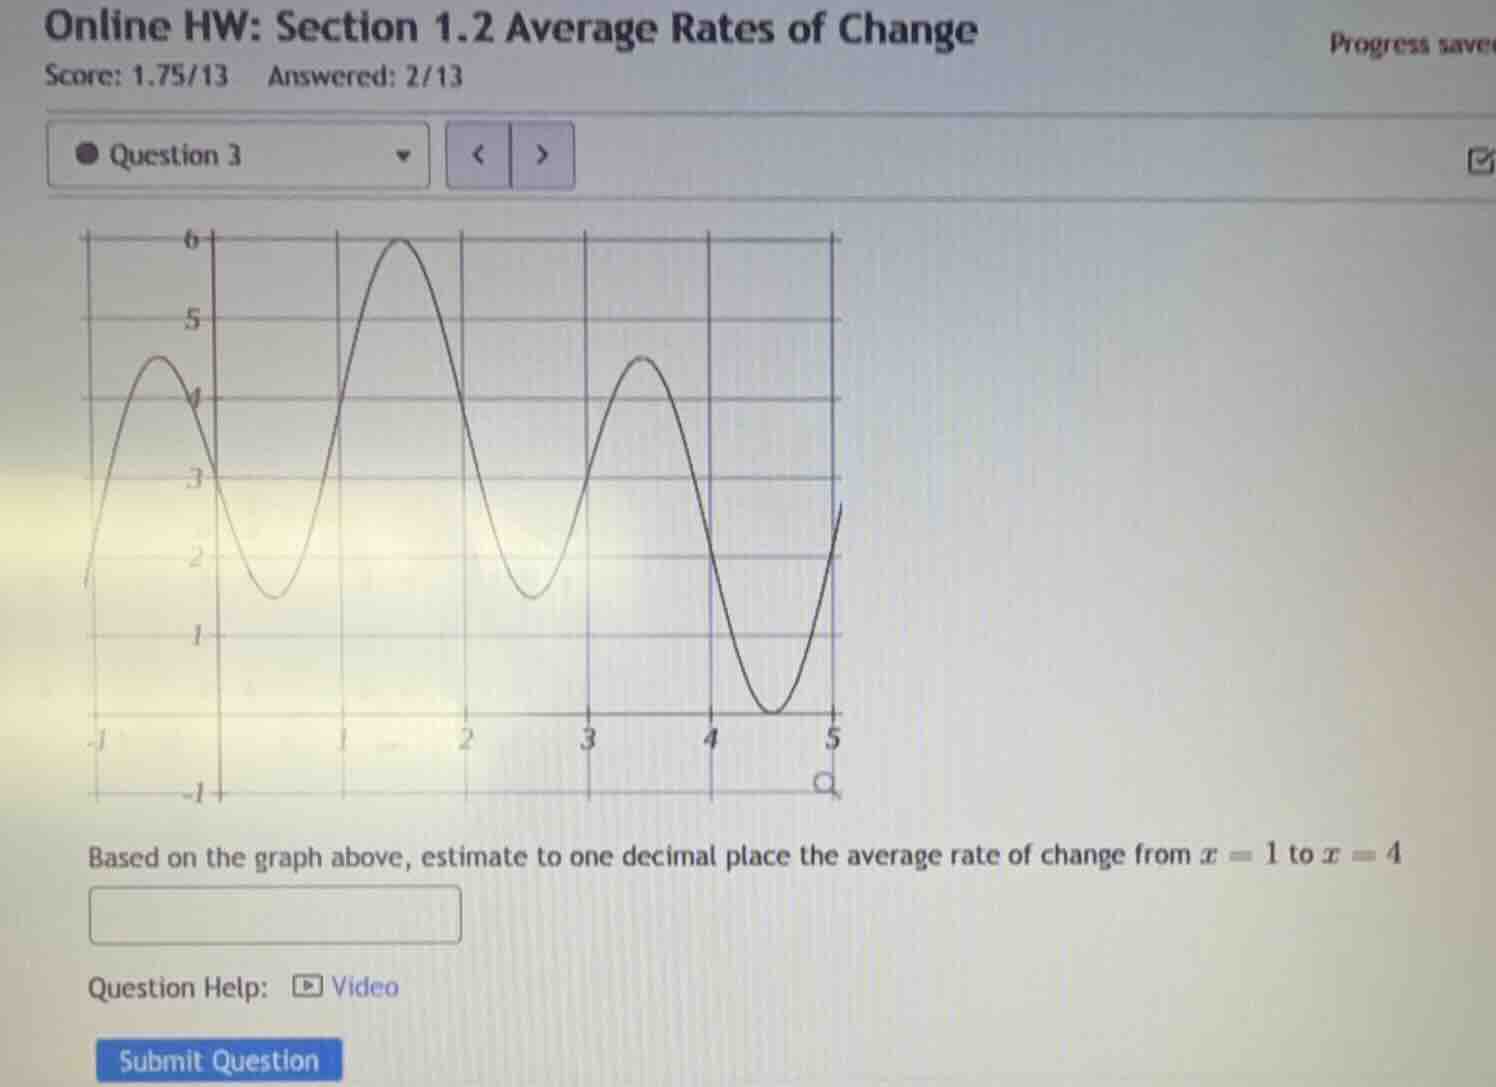
based on the graph above, estimate to one decimal place the average rate of change from ( x = 1 ) to ( x = 4 )
question help: video
submit question
Step1: Identify values at x=1 and x=4
From the graph, at \( x = 1 \), the \( y \)-value (let's call it \( f(1) \)) is 6 (since the peak is at \( x=1.5 \) or so, but at \( x=1 \), it's the peak value around 6). At \( x = 4 \), the \( y \)-value (\( f(4) \)) is 2 (looking at the graph, at \( x=4 \), it's on the way down, and then at \( x=4.5 \) it's the minimum, so at \( x=4 \), \( y \approx 2 \)). Wait, maybe better: Let's re - check. Wait, the x - axis: from x=1 to x=4. Let's see the graph: at x=1, the function is at the peak (around y=6), at x=4, the function is at y=2? Wait, no, maybe I misread. Wait, the graph: at x=1, the curve is at the peak (the second peak? Wait, the first peak is left of x=0, then a valley, then at x=1.5 - 2, a peak at y=6, then a valley, then at x=3 - 3.5, a peak at y=4.5, then a valley at x=4.5 (y=0.5) and then up at x=5. Wait, maybe my initial reading was wrong. Let's correct:
Wait, the x - coordinates are marked at - 1, 0, 1, 2, 3, 4, 5. Let's look at the graph:
- At \( x = 1 \): The graph is at the peak (the second peak) with \( y = 6 \) (since the vertical line at x=1, the graph is at y=6).
- At \( x = 4 \): The graph is at \( y = 0.5 \)? Wait, no, the minimum at x=4.5 is y=0.5, so at x=4, the graph is at y=2? Wait, maybe the correct values: Let's assume that at \( x = 1 \), \( f(1)=6 \), and at \( x = 4 \), \( f(4)=0.5 \)? No, that seems off. Wait, maybe the graph: Let's look at the y - axis: the grid lines are at y=-1, 0, 1, 2, 3, 4, 5, 6.
Wait, the problem says "estimate". Let's do it properly. The formula for average rate of change is \( \frac{f(b)-f(a)}{b - a} \), where \( a = 1 \), \( b = 4 \).
So first, find \( f(1) \) and \( f(4) \) from the graph.
Looking at the graph:
- At \( x = 1 \): The graph is at the peak (the second peak) with \( y = 6 \) (so \( f(1)=6 \)).
- At \( x = 4 \): The graph is at the point just before the minimum (at x=4.5). Let's see, the minimum at x=4.5 is at y=0.5, so at x=4, the y - value is approximately 2? Wait, no, let's check the vertical lines. At x=4, the graph is at y=2? Wait, maybe I made a mistake. Let's re - evaluate.
Wait, the average rate of change formula is \( \text{Average Rate of Change}=\frac{f(4)-f(1)}{4 - 1}=\frac{f(4)-f(1)}{3} \)
Let's look at the graph again:
- At \( x = 1 \): The function is at its maximum (the peak) with \( y = 6 \) (so \( f(1)=6 \)).
- At \( x = 4 \): The function is at \( y = 0.5 \)? No, the minimum at x=4.5 is y=0.5, so at x=4, the y - value is 2? Wait, maybe the correct values are: \( f(1)=6 \), \( f(4)=0.5 \). Wait, no, that would give a negative rate. Wait, let's check the graph again.
Wait, the graph: from x=1 (y=6) to x=4 (y=0.5). Then the average rate of change is \( \frac{0.5 - 6}{4 - 1}=\frac{- 5.5}{3}\approx - 1.8 \). But maybe my values are wrong. Wait, maybe at x=1, f(1)=6, at x=4, f(4)=0. Let's try again.
Wait, the x - axis: x=1, x=4. Let's count the grid. The vertical grid lines: each unit is 1. The horizontal grid lines: each unit is 1 (from y=-1 to y=6).
At x=1: The graph is at the peak (the second peak) with y=6 (so f(1)=6).
At x=4: The graph is at y=0 (the minimum is at x=4.5, y=0.5, so at x=4, y is 0? No, the minimum at x=4.5 is y=0.5, so at x=4, y is 2? Wait, I think I messed up. Let's look at the graph again.
Wait, the graph:
- From x=1 to x=2: it's a peak at x=1.5 (y=6), then down to x=2 (y=4).
- From x=2 to x=3: down to a valley (y=1.5), then up to x=3 (y=4.5).
- From x=3 to x=4: down to x=4 (y=2), then down to x=4.5 (y=0.5), then up to x=5 (y=2.5).
Ah, that's a better reading. So:
- At \…

Snap & solve any problem in the app
Get step-by-step solutions on Sovi AI
Photo-based solutions with guided steps
Explore more problems and detailed explanations
-2.0