QUESTION IMAGE
Question
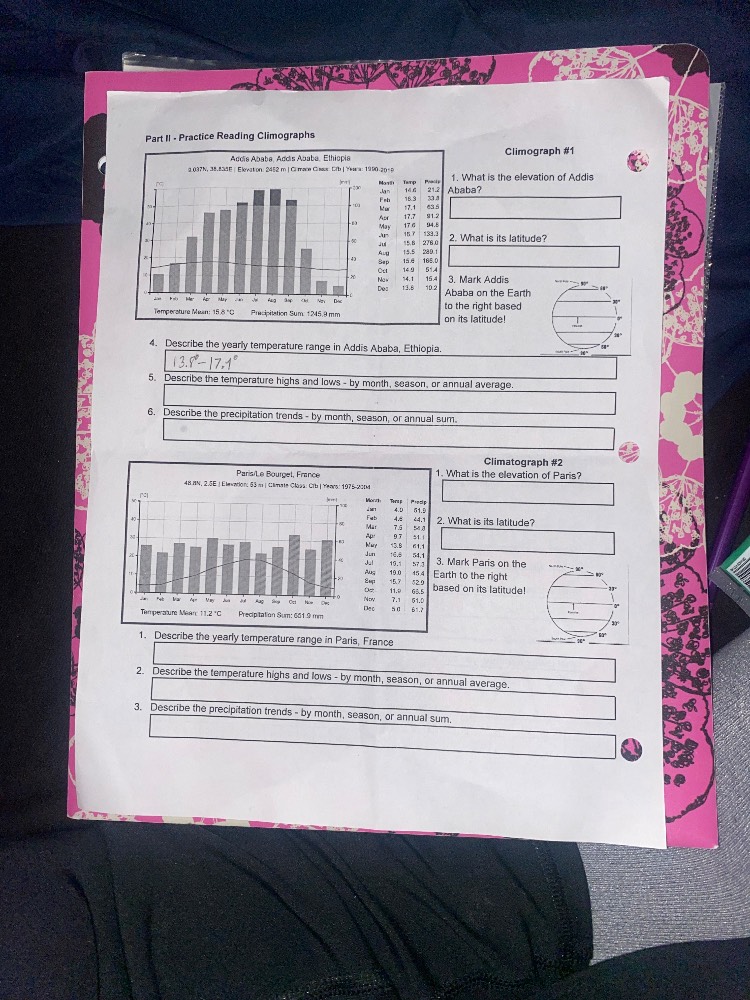
part ii - practice reading climographs
climograph #1
addis ababa, addis ababa, ethiopia
9.037n, 38.745e | elevation: 2408 m | climate class: cfb | years: 1990-2019
temperature mean: 15.8 °c precipitation sum: 1248.9 mm
- what is the elevation of addis
ababa?
- what is its latitude?
- mark addis
ababa on the earth
on the right based
on its latitude!
- describe the yearly temperature range in addis ababa, ethiopia.
- describe the temperature highs and lows - by month, season, or annual average.
- describe the precipitation trends - by month, season, or annual sum.
climatograph #2
paris/le bourget, france
48.9n, 2.5e | elevation: 43 m | climate class: cfb | years: 1971-2000
temperature mean: 11.2 °c precipitation sum: 651.9 mm
- what is the elevation of paris?
- what is its latitude?
- mark paris on the
earth to the right
based on its latitude!
- describe the yearly temperature range in paris, france
- describe the temperature highs and lows - by month, season, or annual average.
- describe the precipitation trends - by month, season, or annual sum.
Step1: Extract Addis Ababa data
From Climograph #1:
Elevation: $2408\ \text{m}$, Latitude: $9.03^\circ\text{N}$
Temp range: $\text{Max temp} - \text{Min temp} = 21.2 - 13.9 = 7.3^\circ\text{C}$
Temp pattern: Warmest (Mar-May, ~17.7-21.2°C), coolest (Dec-Feb, ~13.9-15.3°C), mild annual avg ($15.8^\circ\text{C}$)
Precipitation: Highest (Jun-Sep, ~164.9-259.8 mm), lowest (Dec-Feb, ~15.3-20.8 mm); annual sum $1246.9\ \text{mm}$
Step2: Extract Paris data
From Climograph #2:
Elevation: $42\ \text{m}$, Latitude: $48.8^\circ\text{N}$
Temp range: $\text{Max temp} - \text{Min temp} = 19.5 - 4.3 = 15.2^\circ\text{C}$
Temp pattern: Warmest (Jun-Aug, ~17.5-19.5°C), coolest (Dec-Feb, ~4.3-6.2°C), annual avg ($11.2^\circ\text{C}$)
Precipitation: Evenly distributed (40.5-65.6 mm/month); annual sum $651.9\ \text{mm}$
Step3: Map latitudes
- Addis Ababa ($9.03^\circ\text{N}$): Mark near the equator (0°) on the northern hemisphere side.
- Paris ($48.8^\circ\text{N}$): Mark halfway between 30°N and 60°N on the northern hemisphere side.

Snap & solve any problem in the app
Get step-by-step solutions on Sovi AI
Photo-based solutions with guided steps
Explore more problems and detailed explanations
Climograph #1 (Addis Ababa, Ethiopia)
- Elevation: $2408\ \text{m}$
- Latitude: $9.03^\circ\text{N}$
- (Map marking: Position near the equator in the northern hemisphere)
- Yearly temperature range: $7.3^\circ\text{C}$
- Temperature pattern: Warmest in March-May (17.7–21.2°C), coolest in December-February (13.9–15.3°C), with a mild annual average of $15.8^\circ\text{C}$.
- Precipitation trends: Heavy rain in June-September (164.9–259.8 mm), very dry in December-February (15.3–20.8 mm); annual total is $1246.9\ \text{mm}$.
Climograph #2 (Paris, France)
- Elevation: $42\ \text{m}$
- Latitude: $48.8^\circ\text{N}$
- (Map marking: Position between 30°N and 60°N in the northern hemisphere)
- Yearly temperature range: $15.2^\circ\text{C}$
- Temperature pattern: Warmest in June-August (17.5–19.5°C), coolest in December-February (4.3–6.2°C), with an annual average of $11.2^\circ\text{C}$.
- Precipitation trends: Relatively evenly distributed throughout the year (40.5–65.6 mm per month); annual total is $651.9\ \text{mm}$.