QUESTION IMAGE
Question
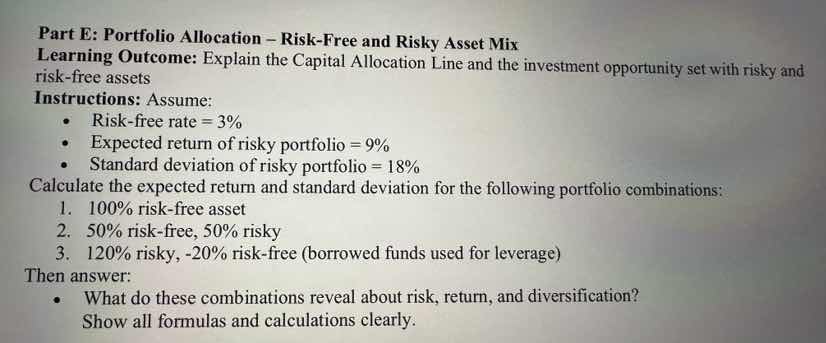
part e: portfolio allocation – risk-free and risky asset mix
learning outcome: explain the capital allocation line and the investment opportunity set with risky and risk - free assets
instructions: assume:
- risk - free rate = 3%
- expected return of risky portfolio = 9%
- standard deviation of risky portfolio = 18%
calculate the expected return and standard deviation for the following portfolio combinations:
- 100% risk - free asset
- 50% risk - free, 50% risky
- 120% risky, -20% risk - free (borrowed funds used for leverage)
then answer:
- what do these combinations reveal about risk, return, and diversification?
show all formulas and calculations clearly.
Step1: Define portfolio return formula
The expected return of a portfolio combining a risk-free asset ($R_f$) and a risky portfolio ($R_p$) is:
$$R_{portfolio} = w_f R_f + w_p R_p$$
where $w_f$ = weight of risk-free asset, $w_p$ = weight of risky portfolio, and $w_f + w_p = 1$
Step2: Define portfolio standard deviation formula
The standard deviation of the portfolio (since risk-free asset has $\sigma_f=0$) is:
$$\sigma_{portfolio} = w_p \sigma_p$$
where $\sigma_p$ = standard deviation of risky portfolio
---
For Portfolio 1: 100% risk-free asset
Step1: Assign weights
$w_f=1$, $w_p=0$, $R_f=0.03$, $\sigma_p=0.18$
Step2: Calculate return
$$R_{portfolio} = 1*0.03 + 0*0.09 = 0.03$$
Step3: Calculate standard deviation
$$\sigma_{portfolio} = 0*0.18 = 0$$
---
For Portfolio 2: 50% risk-free, 50% risky
Step1: Assign weights
$w_f=0.5$, $w_p=0.5$, $R_f=0.03$, $R_p=0.09$, $\sigma_p=0.18$
Step2: Calculate return
$$R_{portfolio} = 0.5*0.03 + 0.5*0.09 = 0.015 + 0.045 = 0.06$$
Step3: Calculate standard deviation
$$\sigma_{portfolio} = 0.5*0.18 = 0.09$$
---
For Portfolio 3: 120% risky, -20% risk-free
Step1: Assign weights
$w_f=-0.2$, $w_p=1.2$, $R_f=0.03$, $R_p=0.09$, $\sigma_p=0.18$
Step2: Calculate return
$$R_{portfolio} = (-0.2)*0.03 + 1.2*0.09 = -0.006 + 0.108 = 0.102$$
Step3: Calculate standard deviation
$$\sigma_{portfolio} = 1.2*0.18 = 0.216$$
---
Interpretation of combinations
Step1: Risk-return relationship
As the weight of the risky portfolio increases (including leveraging by borrowing at the risk-free rate), portfolio expected return rises, and portfolio standard deviation (risk) also rises linearly.
Step2: Diversification note
This combination only uses a single risky portfolio and a risk-free asset, so it does not show diversification across multiple risky assets. Instead, it demonstrates the Capital Allocation Line (CAL) tradeoff: investors can adjust risk-return by mixing a risky portfolio with risk-free assets, or leverage to amplify both risk and return.

Snap & solve any problem in the app
Get step-by-step solutions on Sovi AI
Photo-based solutions with guided steps
Explore more problems and detailed explanations
Portfolio Calculations:
- 100% risk-free asset:
- Expected return: 3%
- Standard deviation: 0%
- 50% risk-free, 50% risky:
- Expected return: 6%
- Standard deviation: 9%
- 120% risky, -20% risk-free:
- Expected return: 10.2%
- Standard deviation: 21.6%
Interpretation:
These combinations reveal a direct, linear tradeoff between risk (standard deviation) and expected return: increasing exposure to the risky portfolio (including using leverage by borrowing at the risk-free rate) increases both the portfolio's expected return and its volatility. This is the core of the Capital Allocation Line: investors can choose their preferred risk-return point by mixing a risky portfolio with risk-free assets. No diversification benefit is shown here, as we are not combining multiple risky assets, only a single risky portfolio with a risk-free asset.