QUESTION IMAGE
Question
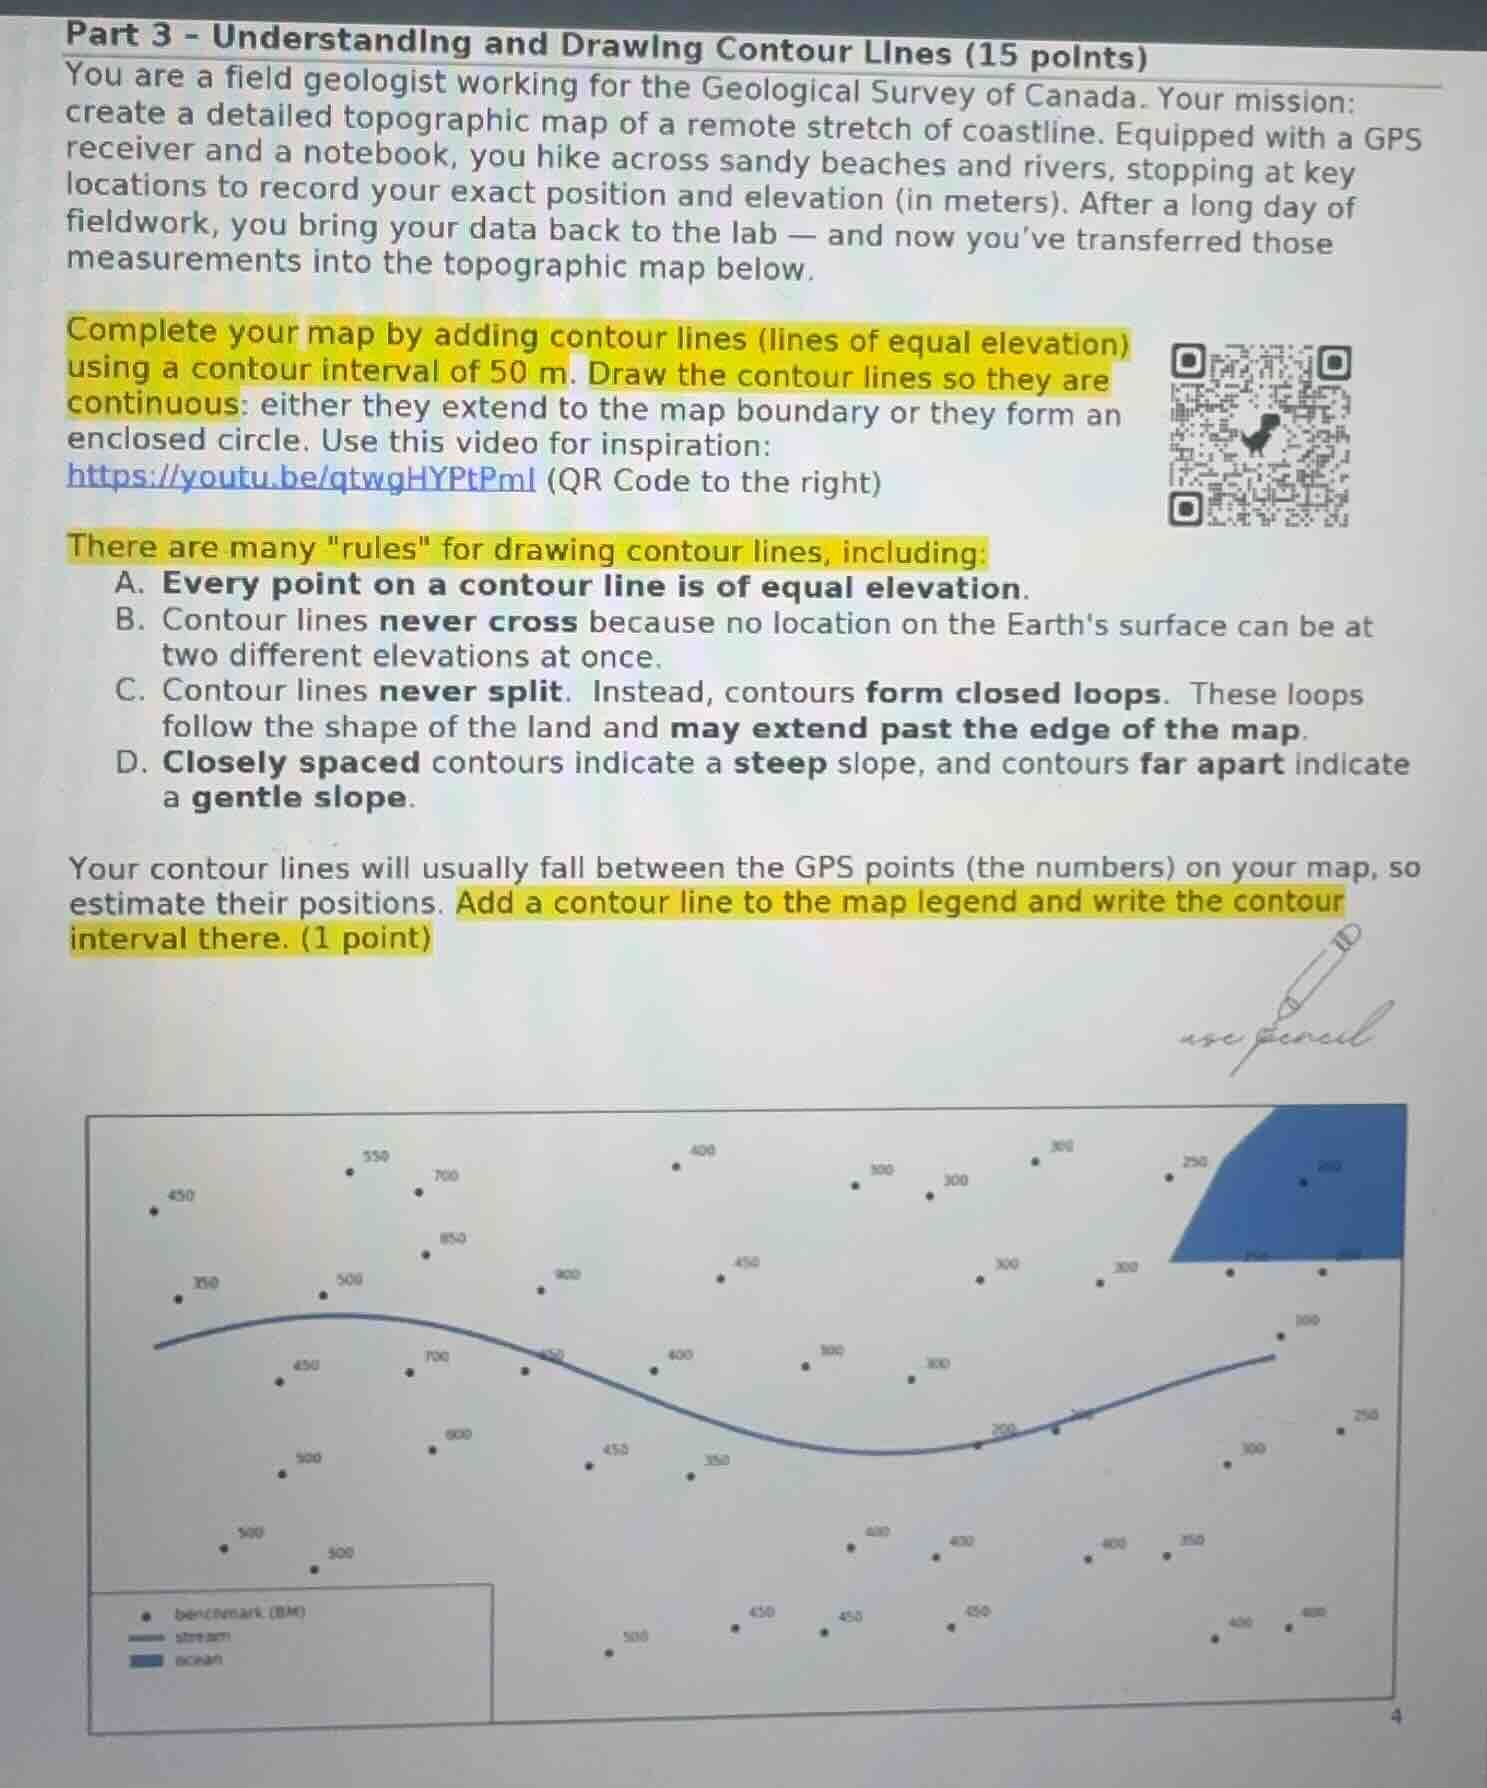
part 3 - understanding and drawing contour lines (15 points)
you are a field geologist working for the geological survey of canada. your mission:
create a detailed topographic map of a remote stretch of coastline. equipped with a gps
receiver and a notebook, you hike across sandy beaches and rivers, stopping at key
locations to record your exact position and elevation (in meters). after a long day of
fieldwork, you bring your data back to the lab — and now you’ve transferred those
measurements into the topographic map below.
complete your map by adding contour lines (lines of equal elevation)
using a contour interval of 50 m. draw the contour lines so they are
continuous: either they extend to the map boundary or they form an
enclosed circle. use this video for inspiration:
https://youtu.be/qtwghyptpml (qr code to the right)
there are many
ules\ for drawing contour lines, including:
a. every point on a contour line is of equal elevation.
b. contour lines never cross because no location on the earths surface can be at
two different elevations at once.
c. contour lines never split. instead, contours form closed loops. these loops
follow the shape of the land and may extend past the edge of the map.
d. closely spaced contours indicate a steep slope, and contours far apart indicate
a gentle slope.
your contour lines will usually fall between the gps points (the numbers) on your map, so
estimate their positions. add a contour line to the map legend and write the contour
interval there. (1 point)
map with elevation points and partial contour lines, legend, and ocean area
To draw contour lines with a 50 m interval:
- Identify the elevation of each GPS point. For example, points like 250, 300, 350, 400, 450, 500, 550, 600, 650, 700, 750, 800, 850 are present.
- A contour line connects points of equal elevation. So, for elevation 300 m, find all points (or estimate between points) that should be at 300 m and draw a continuous line (either to the map boundary or a closed loop). Repeat for other elevations (e.g., 350, 400, etc.), ensuring lines don't cross or split.
- For the legend, add a contour line symbol and label the contour interval as 50 m.

Snap & solve any problem in the app
Get step-by-step solutions on Sovi AI
Photo-based solutions with guided steps
Explore more problems and detailed explanations
To complete the map:
- Draw Contour Lines: Using a 50 m contour interval, connect points (or estimate between them) of equal elevation. For example, draw a line through all 300 m - elevation - related positions (either to the map edge or as a closed loop), repeat for 350 m, 400 m, etc. Ensure lines are continuous, do not cross, and do not split.
- Legend: Add a contour line to the legend and write “Contour Interval: 50 m” next to it.
(Note: The actual drawing requires using the map’s GPS points to estimate and connect equal - elevation positions following contouring rules.)