QUESTION IMAGE
Question
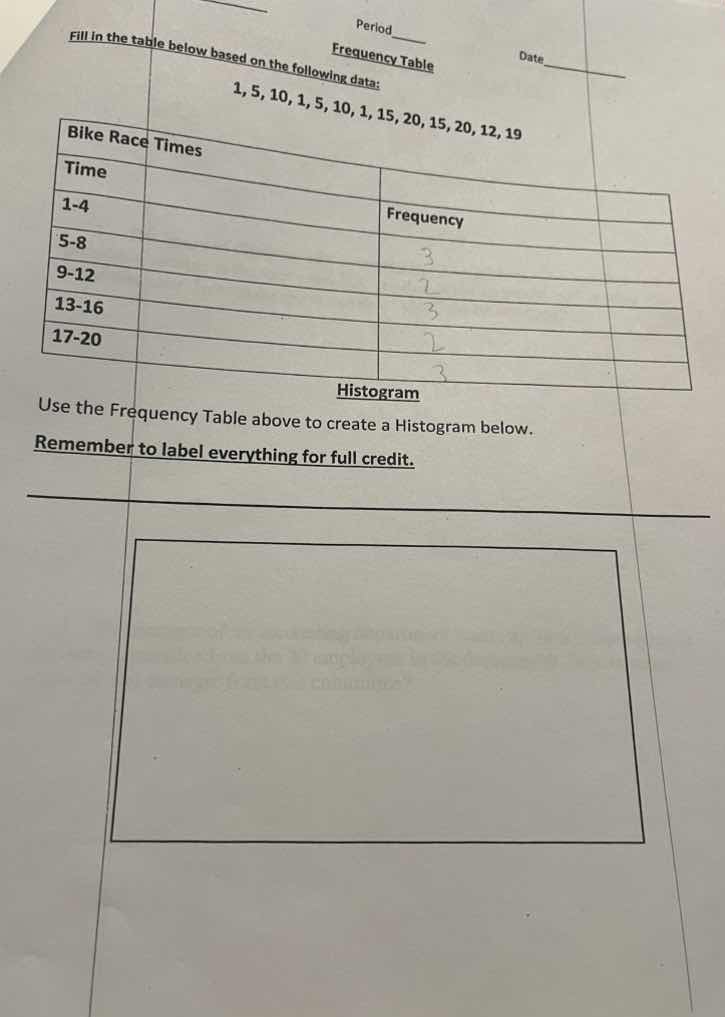
period ____ date ____ frequency table fill in the table below based on the following data: 1, 5, 10, 1, 5, 10, 1, 15, 20, 15, 20, 12, 19 bike race times time frequency 1 - 4 5 - 8 9 - 12 13 - 16 17 - 20 histogram use the frequency table above to create a histogram below. remember to label everything for full credit.
Part 1: Filling the Frequency Table
Step1: List the data
The data is: \(1, 5, 10, 1, 5, 10, 1, 15, 20, 15, 20, 12, 19\)
Step2: Count for 1 - 4
Numbers in \(1 - 4\): \(1, 1, 1\) → Frequency = \(3\)
Step3: Count for 5 - 8
Numbers in \(5 - 8\): \(5, 5\) → Frequency = \(2\)
Step4: Count for 9 - 12
Numbers in \(9 - 12\): \(10, 10, 12\) → Frequency = \(3\)
Step5: Count for 13 - 16
Numbers in \(13 - 16\): \(15, 15\) → Frequency = \(2\)
Step6: Count for 17 - 20
Numbers in \(17 - 20\): \(20, 20, 19\) → Frequency = \(3\)
Filled Frequency Table:
| Bike Race Times | Frequency |
|---|---|
| 5 - 8 | 2 |
| 9 - 12 | 3 |
| 13 - 16 | 2 |
| 17 - 20 | 3 |
Part 2: Creating the Histogram
To create the histogram:
- X - axis (Horizontal): Label it "Bike Race Times (in appropriate units, e.g., minutes)" and mark the intervals: \(1 - 4\), \(5 - 8\), \(9 - 12\), \(13 - 16\), \(17 - 20\).
- Y - axis (Vertical): Label it "Frequency" and mark the frequency values (e.g., 0, 1, 2, 3, 4).
- For each interval, draw a bar whose height corresponds to the frequency of that interval:
- For \(1 - 4\): Bar height = 3
- For \(5 - 8\): Bar height = 2
- For \(9 - 12\): Bar height = 3
- For \(13 - 16\): Bar height = 2
- For \(17 - 20\): Bar height = 3
(Note: Since this is a text - based response, we can't draw the actual histogram, but the above instructions describe how to create it.)

Snap & solve any problem in the app
Get step-by-step solutions on Sovi AI
Photo-based solutions with guided steps
Explore more problems and detailed explanations
Step1: List the data
The data is: \(1, 5, 10, 1, 5, 10, 1, 15, 20, 15, 20, 12, 19\)
Step2: Count for 1 - 4
Numbers in \(1 - 4\): \(1, 1, 1\) → Frequency = \(3\)
Step3: Count for 5 - 8
Numbers in \(5 - 8\): \(5, 5\) → Frequency = \(2\)
Step4: Count for 9 - 12
Numbers in \(9 - 12\): \(10, 10, 12\) → Frequency = \(3\)
Step5: Count for 13 - 16
Numbers in \(13 - 16\): \(15, 15\) → Frequency = \(2\)
Step6: Count for 17 - 20
Numbers in \(17 - 20\): \(20, 20, 19\) → Frequency = \(3\)
Filled Frequency Table:
| Bike Race Times | Frequency |
|---|---|
| 5 - 8 | 2 |
| 9 - 12 | 3 |
| 13 - 16 | 2 |
| 17 - 20 | 3 |
Part 2: Creating the Histogram
To create the histogram:
- X - axis (Horizontal): Label it "Bike Race Times (in appropriate units, e.g., minutes)" and mark the intervals: \(1 - 4\), \(5 - 8\), \(9 - 12\), \(13 - 16\), \(17 - 20\).
- Y - axis (Vertical): Label it "Frequency" and mark the frequency values (e.g., 0, 1, 2, 3, 4).
- For each interval, draw a bar whose height corresponds to the frequency of that interval:
- For \(1 - 4\): Bar height = 3
- For \(5 - 8\): Bar height = 2
- For \(9 - 12\): Bar height = 3
- For \(13 - 16\): Bar height = 2
- For \(17 - 20\): Bar height = 3
(Note: Since this is a text - based response, we can't draw the actual histogram, but the above instructions describe how to create it.)