QUESTION IMAGE
Question
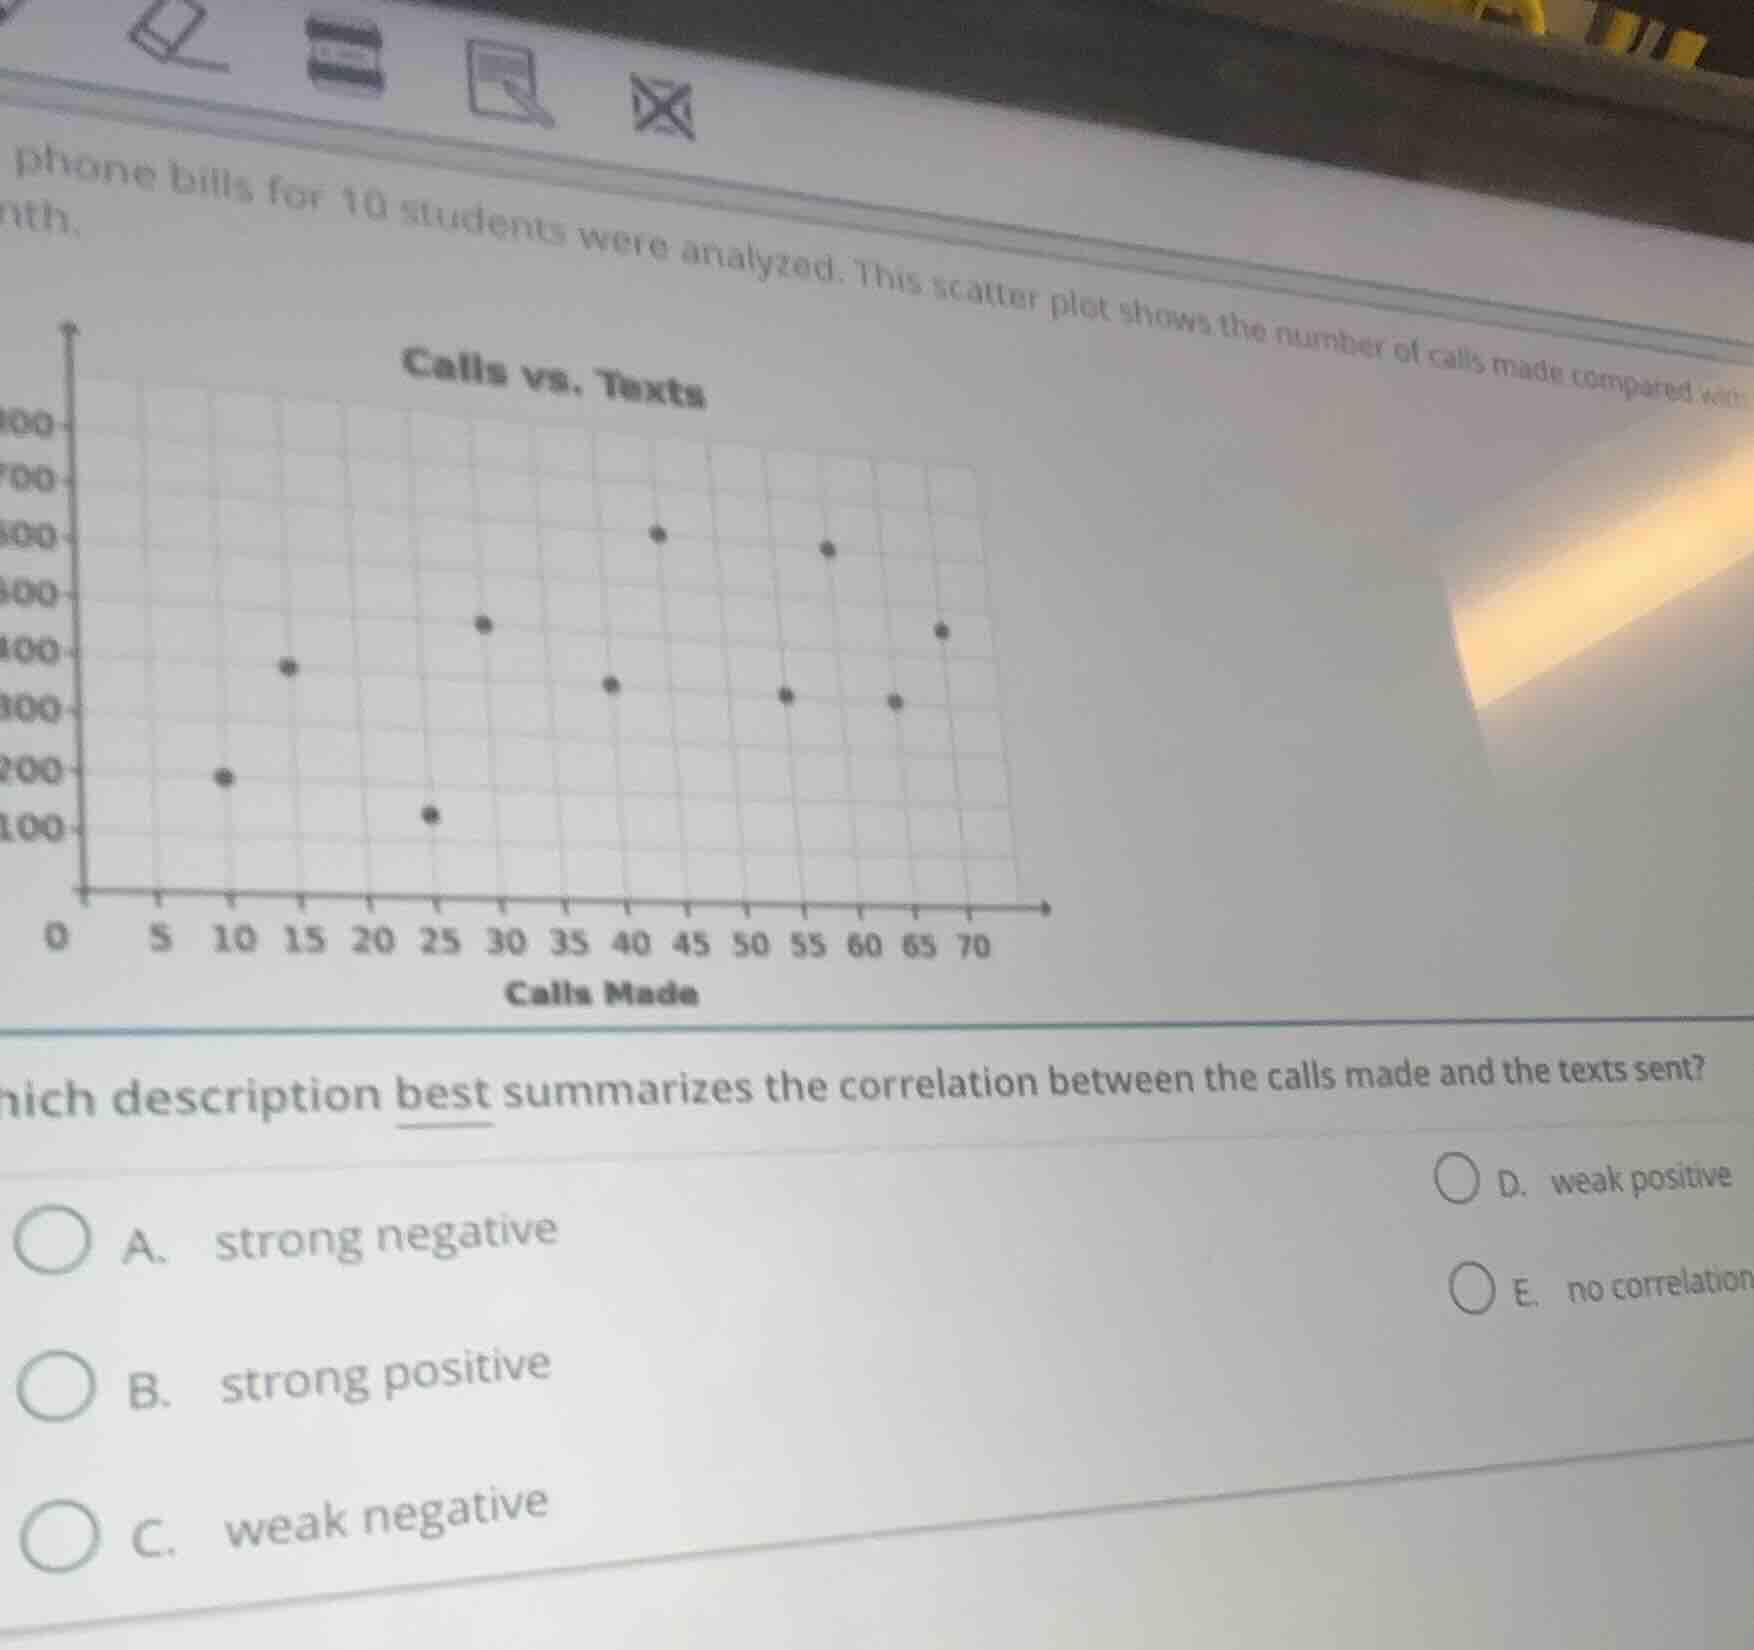
phone bills for 10 students were analyzed. this scatter plot shows the number of calls made compared with calls vs. texts nth, hich description best summarizes the correlation between the calls made and the texts sent? a. strong negative b. strong positive c. weak negative d. weak positive e. no correlation
Brief Explanations
- Observe the scatter plot: As the number of calls made (x-axis) increases, the number of texts sent (y-axis) generally increases, indicating a positive correlation.
- Assess the strength: The points are loosely clustered, not tightly following a straight line, so the correlation is weak rather than strong.

Snap & solve any problem in the app
Get step-by-step solutions on Sovi AI
Photo-based solutions with guided steps
Explore more problems and detailed explanations
D. weak positive