QUESTION IMAGE
Question
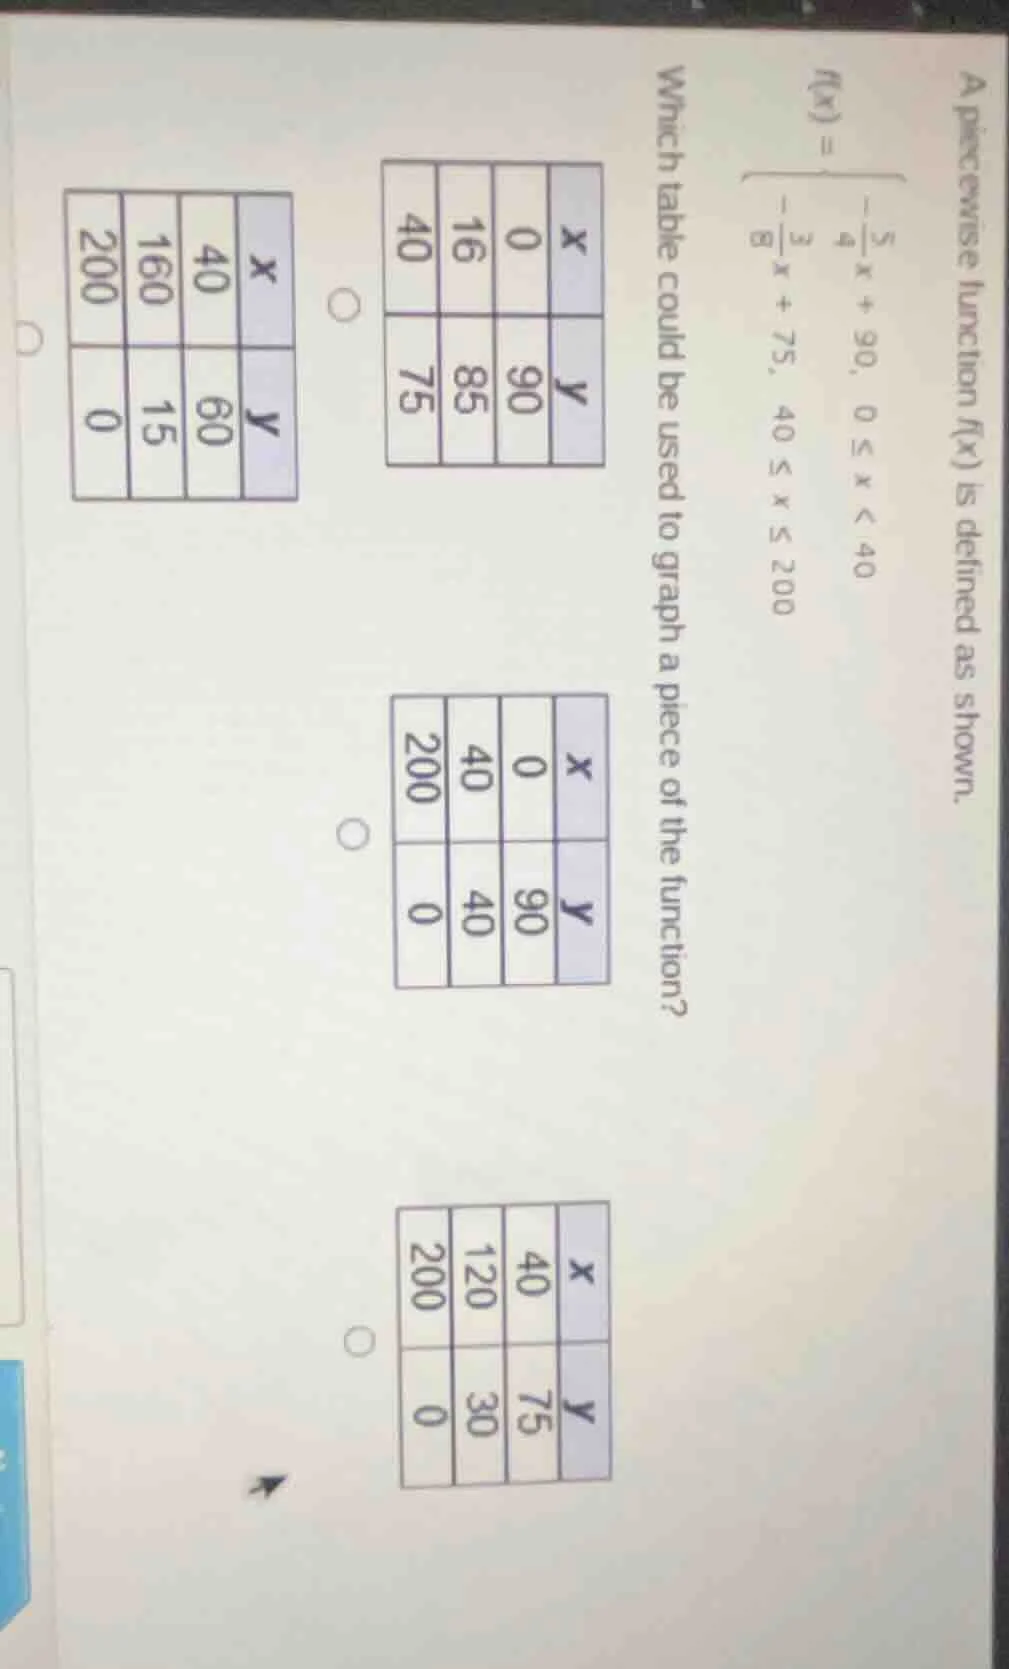
a piecewise function $f(x)$ is defined as shown.$f(x)=\begin{cases}-\frac{5}{4}x + 90, 0leq x < 40\\-\frac{3}{8}x + 75, 40leq xleq 200end{cases}$which table could be used to graph a piece of the function?|$x$|0|16|40|| ---- | ---- | ---- | ---- ||$y$|90|85|75||$x$|0|40|200|| ---- | ---- | ---- | ---- ||$y$|90|40|0||$x$|40|120|200|| ---- | ---- | ---- | ---- ||$y$|75|30|0||$x$|40|160|200|| ---- | ---- | ---- | ---- ||$y$|60|15|0|
Step1: Test first interval x=0
$f(0) = -\frac{5}{4}(0) + 90 = 90$
Step2: Test first interval x=16
$f(16) = -\frac{5}{4}(16) + 90 = -20 + 90 = 70$
Step3: Test second interval x=40
$f(40) = -\frac{3}{8}(40) + 75 = -15 + 75 = 60$
Step4: Test second interval x=200
$f(200) = -\frac{3}{8}(200) + 75 = -75 + 75 = 0$
Step5: Match values to tables
Check which table has (0,90), (40,60), (200,0)

Snap & solve any problem in the app
Get step-by-step solutions on Sovi AI
Photo-based solutions with guided steps
Explore more problems and detailed explanations
The correct table is:
| x | y |
|---|---|
| 160 | 15 |
| 200 | 0 |