QUESTION IMAGE
Question
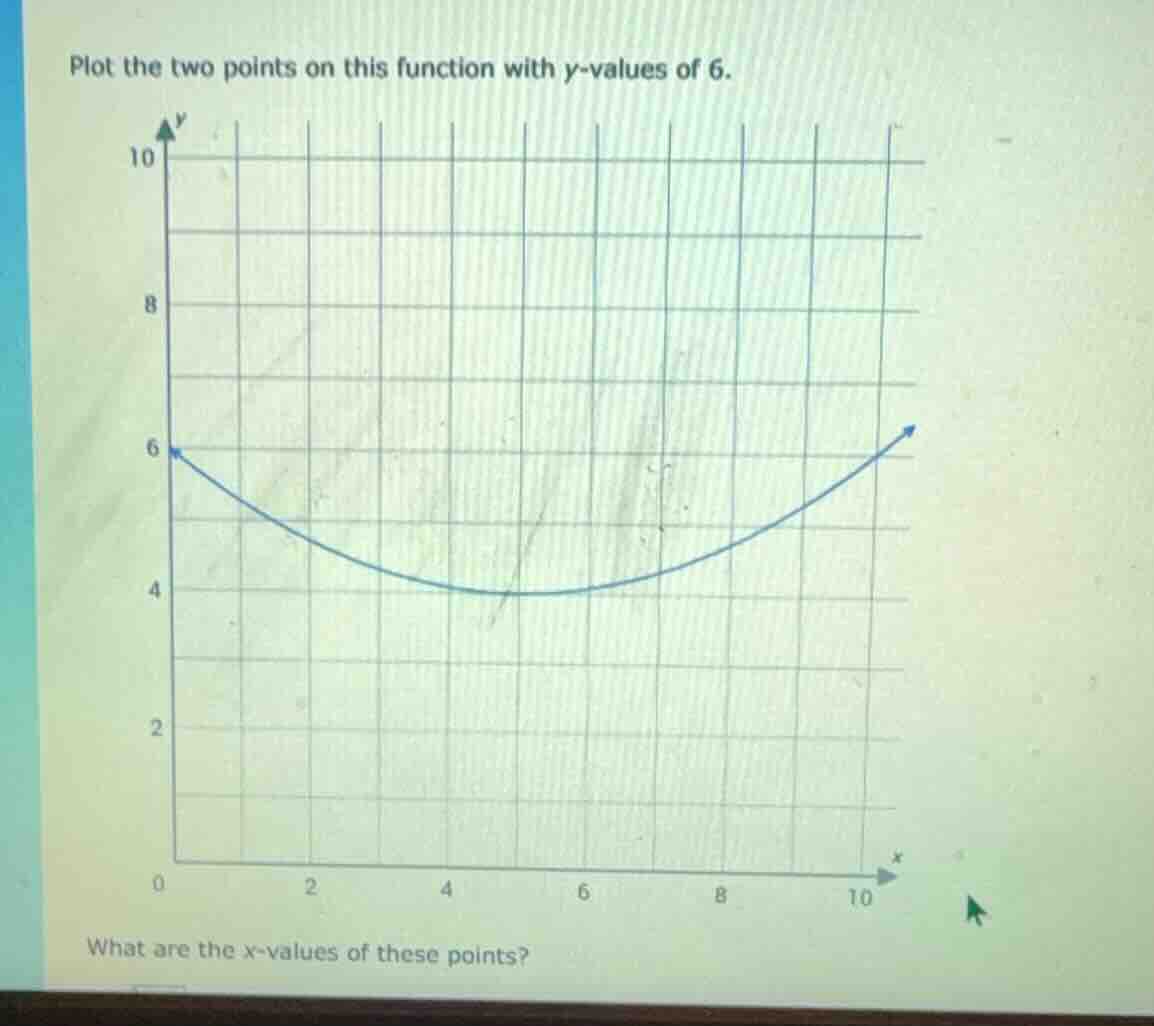
plot the two points on this function with y-values of 6.
what are the x-values of these points?
Step1: Locate y=6 on the graph
Find the horizontal line corresponding to $y=6$.
Step2: Find intersection points
Identify where this line crosses the given curve.
Step3: Read x-values
The first intersection is at $x=0$, the second is at $x=10$.

Snap & solve any problem in the app
Get step-by-step solutions on Sovi AI
Photo-based solutions with guided steps
Explore more problems and detailed explanations
The x-values are 0 and 10, corresponding to the points $(0, 6)$ and $(10, 6)$.