QUESTION IMAGE
Question
- / 2 points
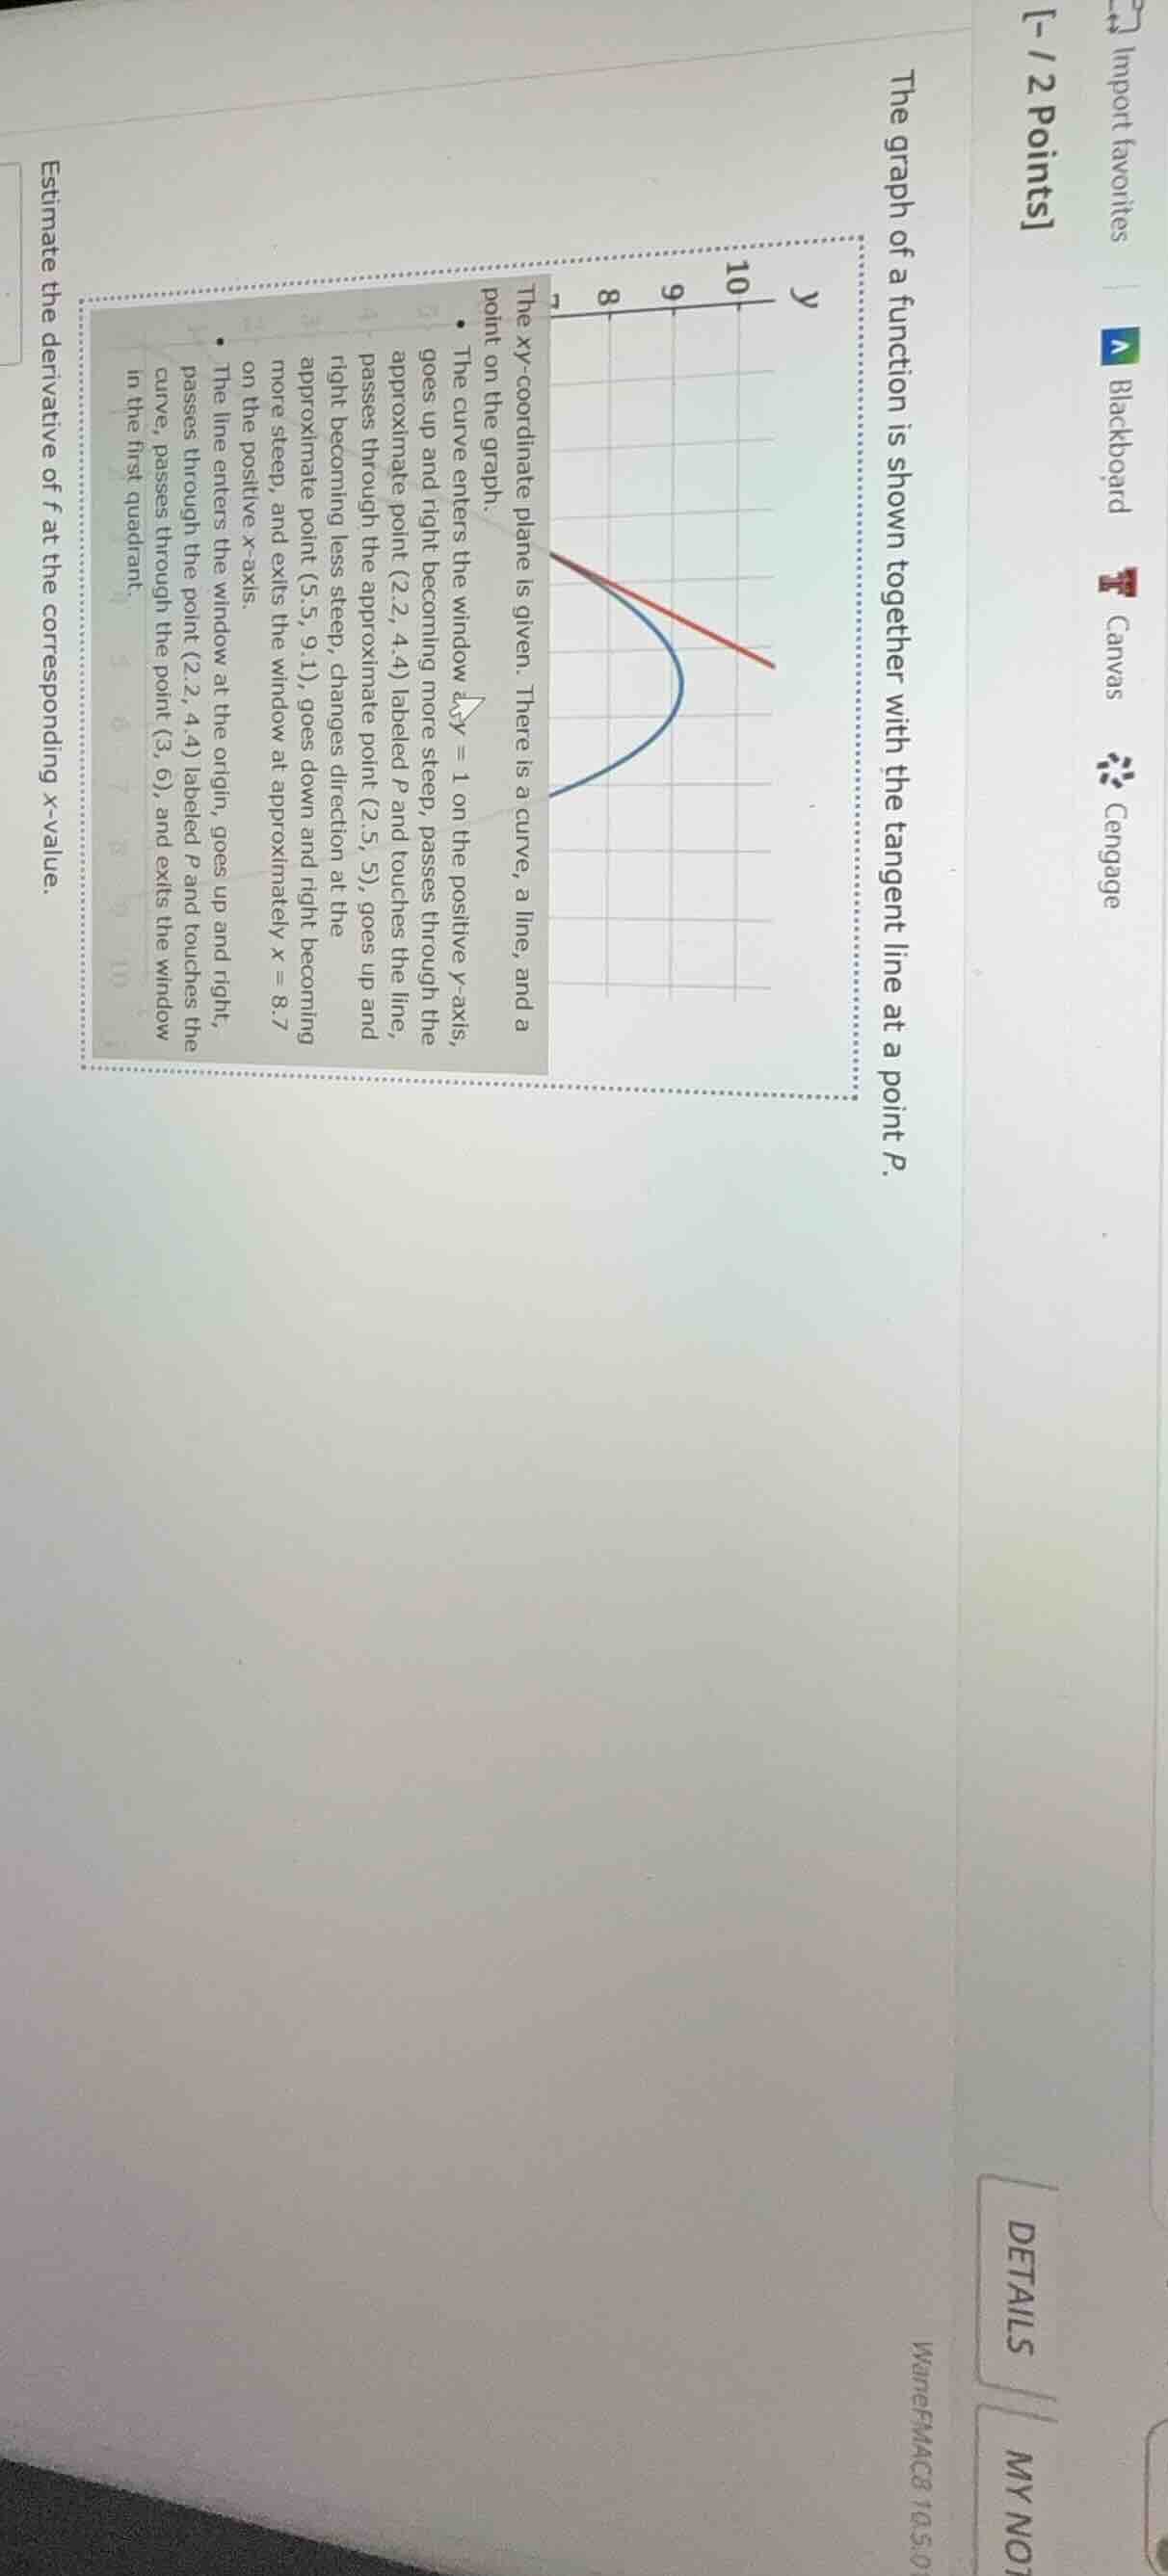
the graph of a function is shown together with the tangent line at a point p.
the xy-coordinate plane is given. there is a curve, a line, and a point on the graph.
- the curve enters the window at y = 1 on the positive y-axis, goes up and right becoming more steep, passes through the approximate point (2.2, 4.4) labeled p and touches the line, passes through the approximate point (2.5, 5), goes up and right becoming less steep, changes direction at the approximate point (5.5, 9.1), goes down and right becoming more steep, and exits the window at approximately x = 8.7 on the positive x-axis.
- the line enters the window at the origin, goes up and right, passes through the point (2.2, 4.4) labeled p and touches the curve, passes through the point (3, 6), and exits the window in the first quadrant.
estimate the derivative of f at the corresponding x-value.
Step1: Identify tangent line points
The tangent line passes through $(0,0)$ and $(3,6)$.
Step2: Calculate slope (derivative)
The derivative $f'(x)$ at point $P$ equals the slope of the tangent line. Use slope formula:
$\text{Slope} = \frac{y_2 - y_1}{x_2 - x_1} = \frac{6 - 0}{3 - 0}$
Step3: Simplify the expression
$\frac{6}{3} = 2$

Snap & solve any problem in the app
Get step-by-step solutions on Sovi AI
Photo-based solutions with guided steps
Explore more problems and detailed explanations
2