QUESTION IMAGE
Question
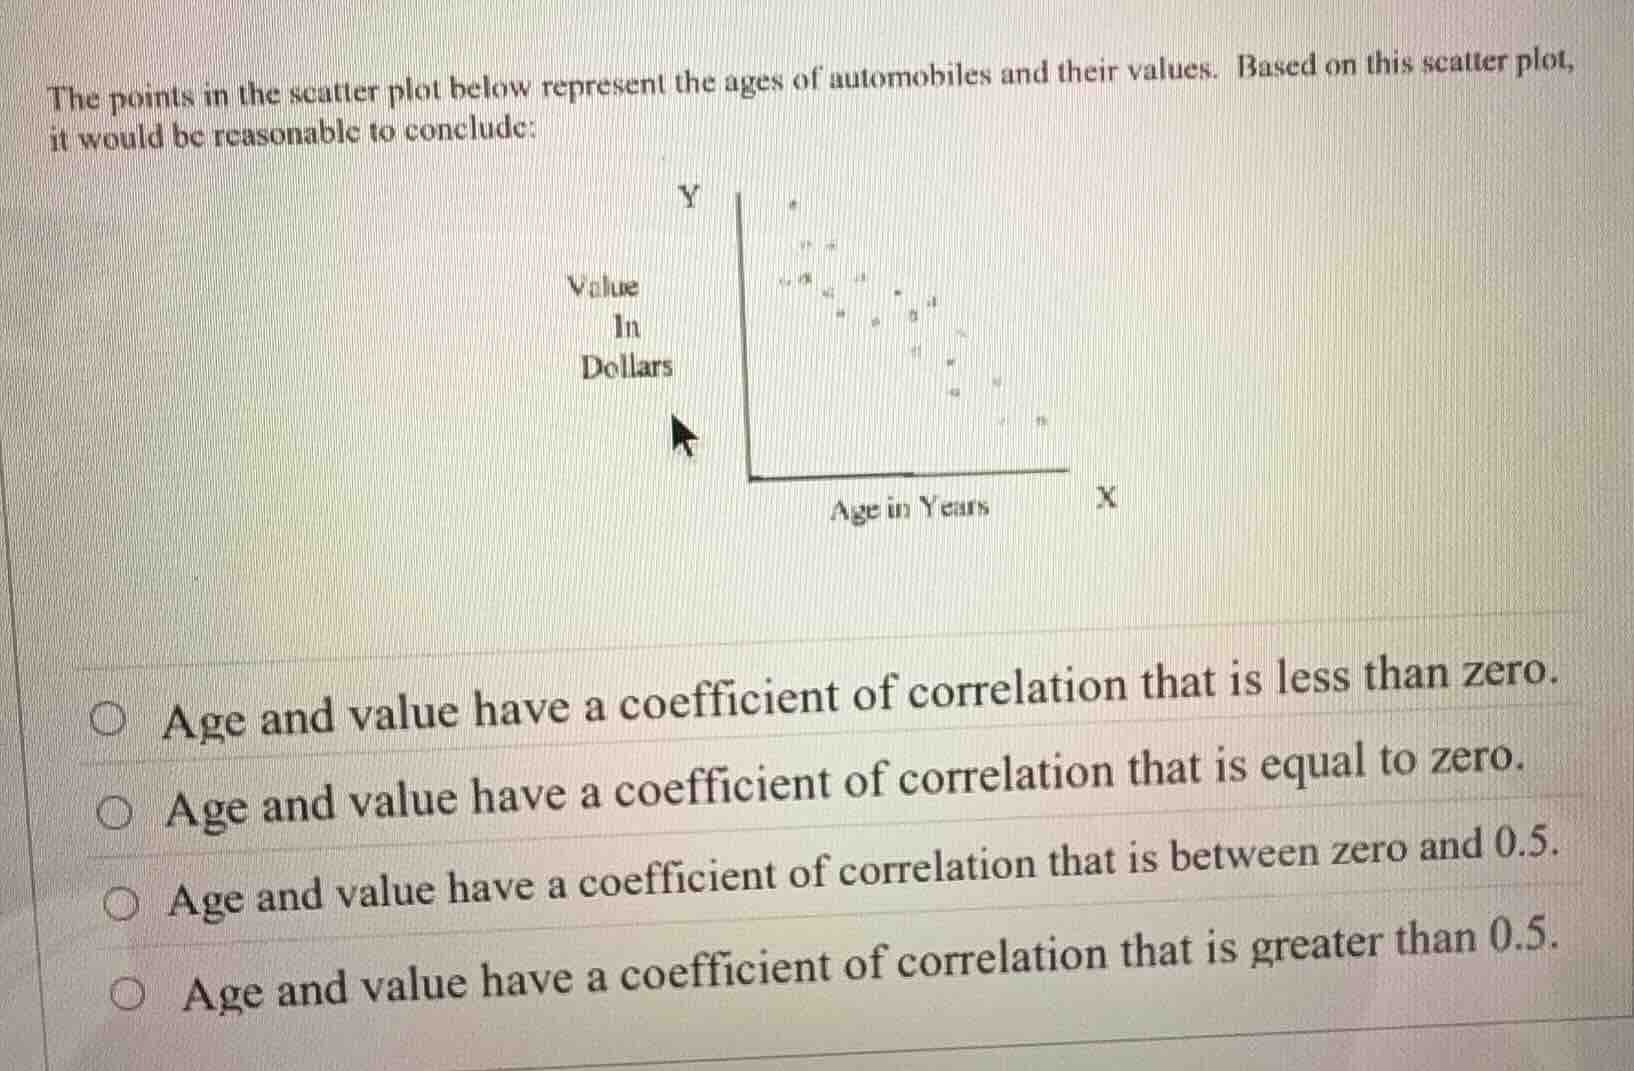
the points in the scatter plot below represent the ages of automobiles and their values. based on this scatter plot, it would be reasonable to conclude:
scatter plot with y - axis labeled value in dollars and x - axis labeled age in years
- age and value have a coefficient of correlation that is less than zero.
- age and value have a coefficient of correlation that is equal to zero.
- age and value have a coefficient of correlation that is between zero and 0.5.
- age and value have a coefficient of correlation that is greater than 0.5.
Brief Explanations
The scatter plot shows that as automobile age (X-axis) increases, their value (Y-axis) decreases. This is a negative linear relationship, which corresponds to a correlation coefficient less than zero.

Snap & solve any problem in the app
Get step-by-step solutions on Sovi AI
Photo-based solutions with guided steps
Explore more problems and detailed explanations
Age and value have a coefficient of correlation that is less than zero.