QUESTION IMAGE
Question
population regression function
the linear regression line shows the overall linear relationship among the plotted points. each position along the line represents where one would expect ( y ) to be given a particular ( x ), based on the linear relationship. assuming the data represents a population, the line is called a population regression function.
the population regression function in terms of the greek letter beta ( \beta ) is ( e(y) = \beta_0 + \beta_1 x ), where ( \beta_0 ) and ( \beta_1 ) are the intercept and slope parameters respectively. the notation ( e(y) ) means expected value of ( y ).
participation activity
2 2 4. population linear regression function.
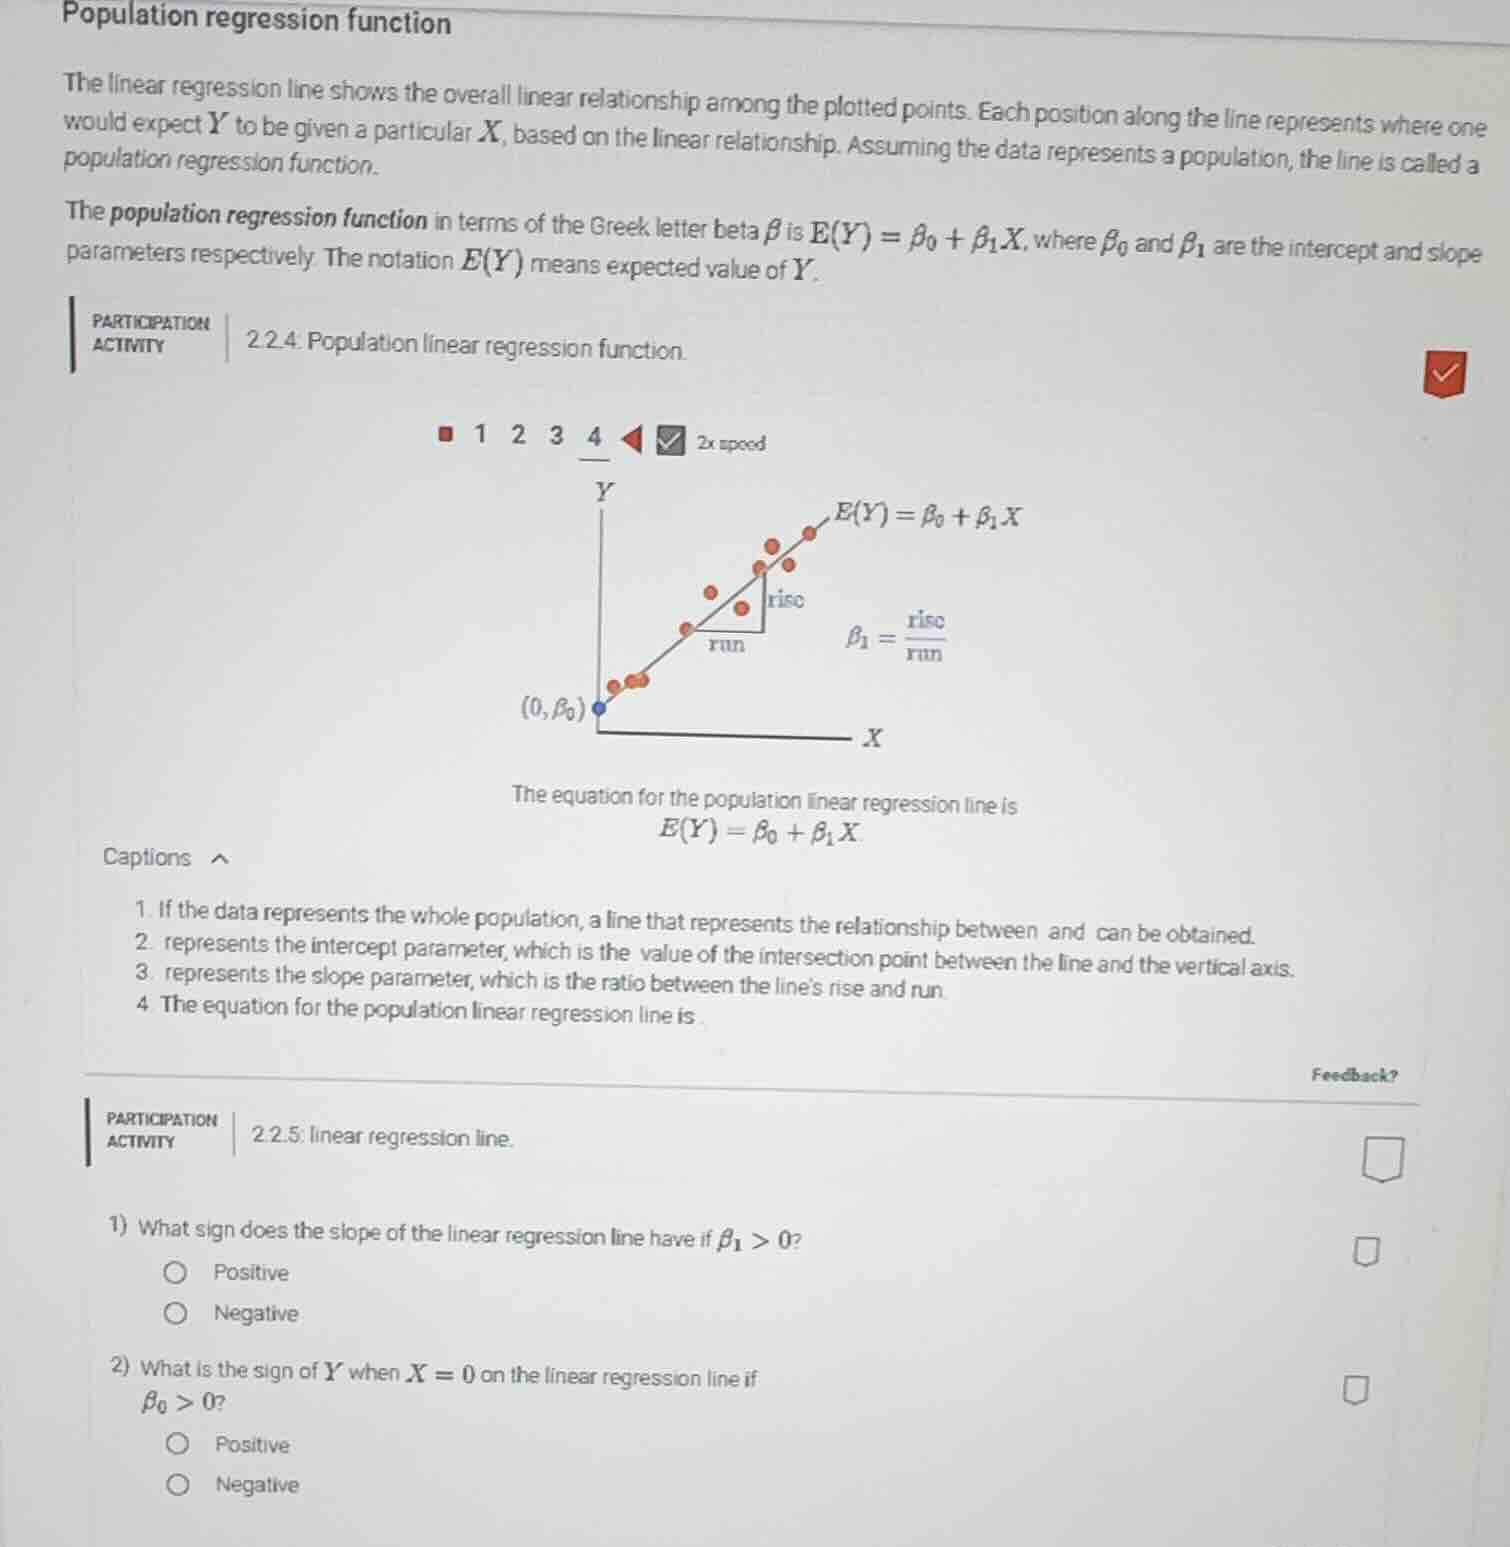
the equation for the population linear regression line is
( e(y) = \beta_0 + \beta_1 x )
captions
- if the data represents the whole population, a line that represents the relationship between and can be obtained.
- represents the intercept parameter, which is the value of the intersection point between the line and the vertical axis.
- represents the slope parameter, which is the ratio between the lines rise and run.
- the equation for the population linear regression line is.
participation activity
2.2.5: linear regression line.
- what sign does the slope of the linear regression line have if ( \beta_1 > 0 )?
- positive
- negative
- what is the sign of ( y ) when ( x = 0 ) on the linear regression line if ( \beta_0 > 0 )?
- positive
- negative
- For the slope parameter $\beta_1$, a positive value indicates that as $X$ increases, $E(Y)$ increases, which corresponds to a positive slope.
- When $X=0$, the value of $Y$ on the regression line is $\beta_0$. If $\beta_0 > 0$, this value is positive.

Snap & solve any problem in the app
Get step-by-step solutions on Sovi AI
Photo-based solutions with guided steps
Explore more problems and detailed explanations
- Positive
- Positive