QUESTION IMAGE
Question
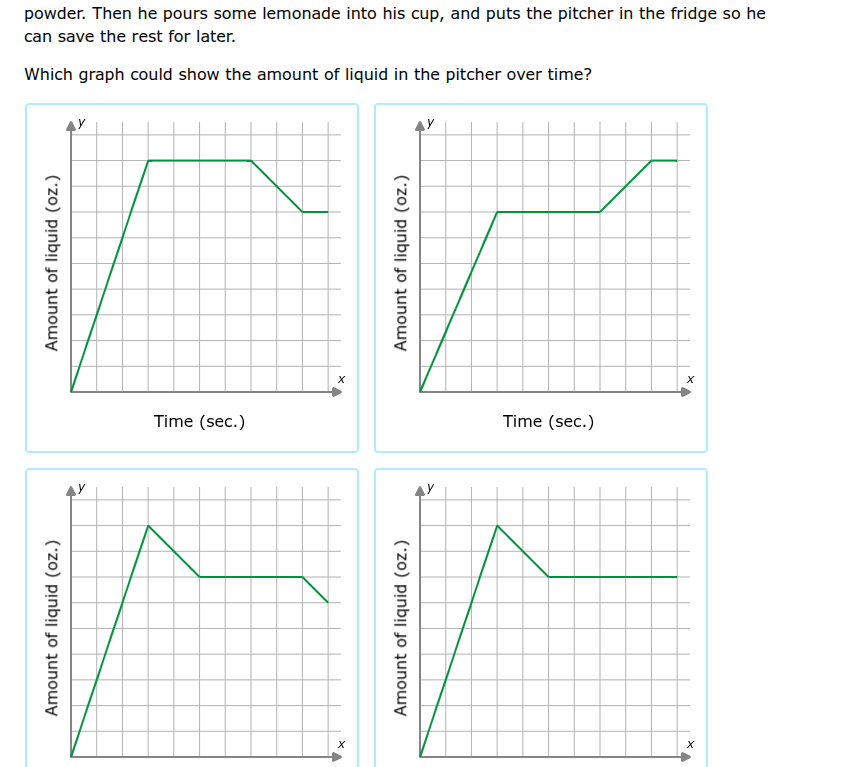
powder. then he pours some lemonade into his cup, and puts the pitcher in the fridge so he can save the rest for later. which graph could show the amount of liquid in the pitcher over time?
Step1: Identify initial action
The pitcher starts empty, so the graph starts at (0,0). As lemonade is poured in, the amount (y-value) increases linearly.
Step2: Identify stationary period
Once the pitcher is filled, the amount stays constant (flat line) while no liquid is added or removed.
Step3: Identify pour-out action
When some lemonade is poured into the cup, the amount in the pitcher decreases linearly to a lower value.
Step4: Identify final stationary period
After pouring, the rest of the lemonade is saved, so the amount stays constant at the lower value indefinitely. This matches the top-left graph.

Snap & solve any problem in the app
Get step-by-step solutions on Sovi AI
Photo-based solutions with guided steps
Explore more problems and detailed explanations
The top-left graph