QUESTION IMAGE
Question
practice
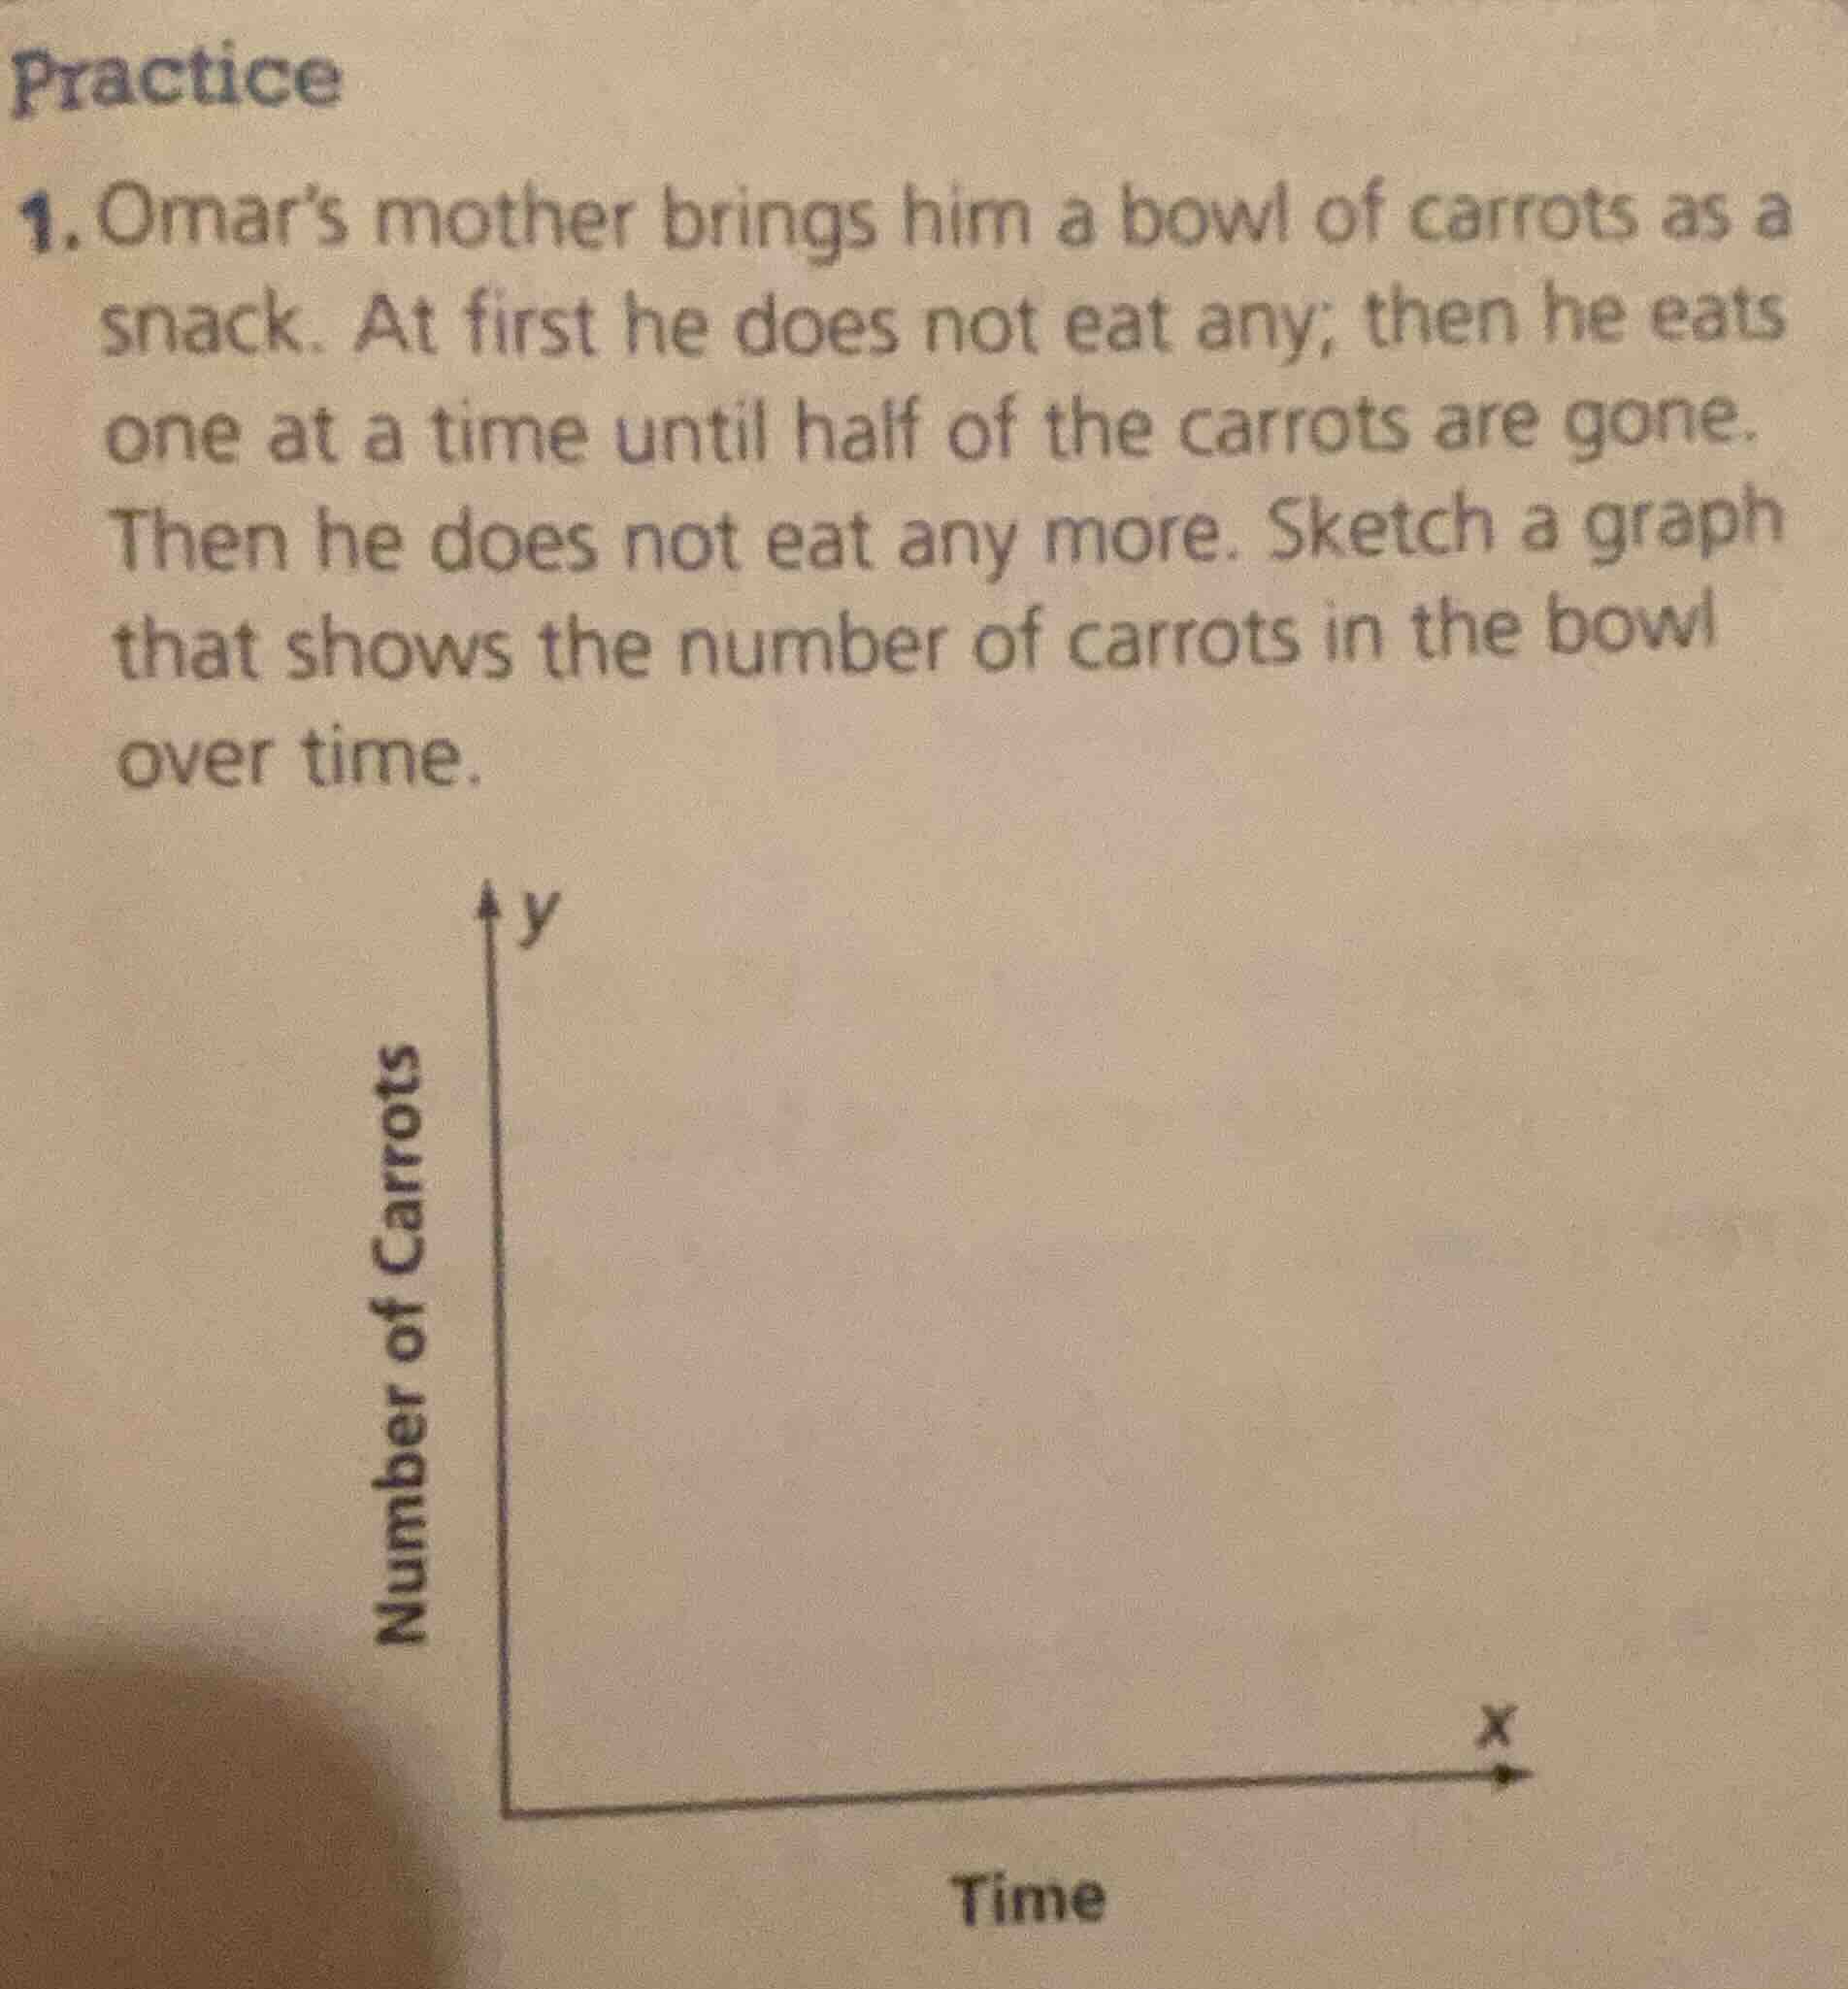
- omars mother brings him a bowl of carrots as a snack. at first he does not eat any; then he eats one at a time until half of the carrots are gone. then he does not eat any more. sketch a graph that shows the number of carrots in the bowl over time.
number of carrots
time
Step1: Define initial state
Let initial carrot count = $C$ (a positive integer). For the first segment of time, the number of carrots stays at $y=C$, a horizontal line starting at the y-axis.
Step2: Define eating phase
As time passes, Omar eats 1 carrot at a time until $\frac{C}{2}$ carrots remain. This is a stepwise decreasing line (each step drops by 1) going from $(t_1, C)$ to $(t_2, \frac{C}{2})$, where $t_1$ is when he starts eating, $t_2$ is when he stops.
Step3: Define final state
After reaching $\frac{C}{2}$ carrots, the number stays constant. This is a horizontal line starting at $(t_2, \frac{C}{2})$ and extending right.

Snap & solve any problem in the app
Get step-by-step solutions on Sovi AI
Photo-based solutions with guided steps
Explore more problems and detailed explanations
The graph has three segments:
- A horizontal line at $y=C$ (starting at the y-axis, $x=0$) for the initial period where Omar does not eat any carrots.
- A stepwise downward-sloping line (each step decreases by 1) that goes from $y=C$ to $y=\frac{C}{2}$ as time increases, representing Omar eating one carrot at a time.
- A horizontal line at $y=\frac{C}{2}$ extending to the right, representing the period where Omar stops eating carrots.
(Note: $C$ is the initial number of carrots in the bowl, a positive whole number.)