QUESTION IMAGE
Question
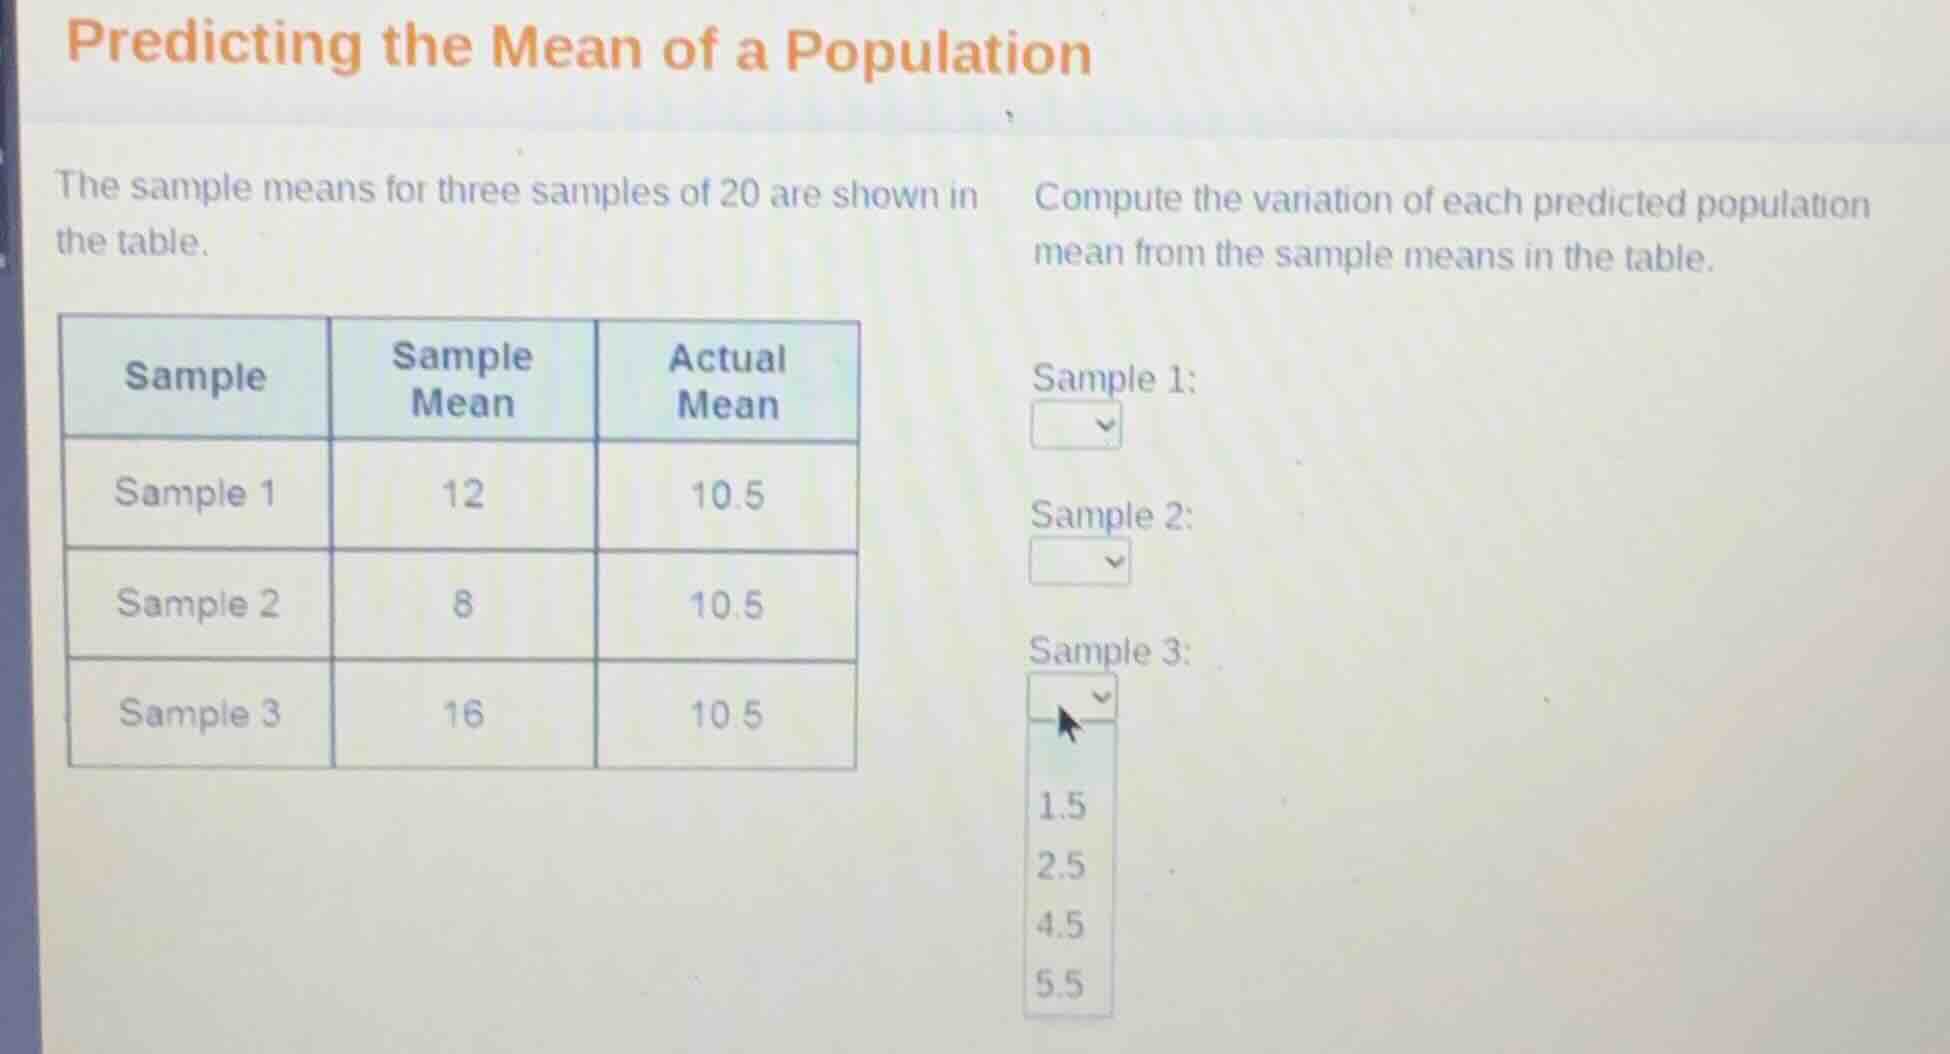
predicting the mean of a population
the sample means for three samples of 20 are shown in the table.
| sample | sample mean | actual mean |
|---|---|---|
| sample 2 | 8 | 10.5 |
| sample 3 | 16 | 10.5 |
compute the variation of each predicted population mean from the sample means in the table.
sample 1:
dropdown
sample 2:
dropdown
sample 3:
dropdown with options 1.5, 2.5, 4.5, 5.5
Step1: Calculate Sample 1 variation
$|12 - 10.5| = 1.5$
Step2: Calculate Sample 2 variation
$|8 - 10.5| = 2.5$
Step3: Calculate Sample 3 variation
$|16 - 10.5| = 5.5$

Snap & solve any problem in the app
Get step-by-step solutions on Sovi AI
Photo-based solutions with guided steps
Explore more problems and detailed explanations
Sample 1: 1.5
Sample 2: 2.5
Sample 3: 5.5